Have you ever been stopped out by a pip, or even less than a pip? Just missed that magical entry? Chances are you are still looking at support and resistance as a single horizontal ‘line in the sand’. Because forex is decentralized, the single line method can be very hit and miss, you might have identified support 108.83, but on another trader’s terminal with a different broker, the support line lies at 108.80. Here at Vantage FX, our analysts have found using a zone to designate support and resistance is much more effective.
In this tutorial, we’ll introduce the concept of support and resistance zones, teach you how to draw them in MT4, and hopefully give you some ideas on how you can use this method to improve your trading.
There’s no ‘line in the sand’
There’s two and there’s a zone in between! Nothing in forex is exact, no technical indicator or analysis method is perfect. Once you realize this and become a little more flexible with your stop losses and limit entries, you will likely see a huge improvement in your trading performance.
Introducing support and resistance zones
Support and resistance zones are gaining a lot of traction in the trading community because they work so well. They go by different names, you may have heard them described as ‘supply and demand zones’ or ‘order blocks’. The concept is very simple: instead of trying to find the be all and end all, ‘line in the sand’ which designates support or resistance, you identify the area of a chart where price is likely to turn.
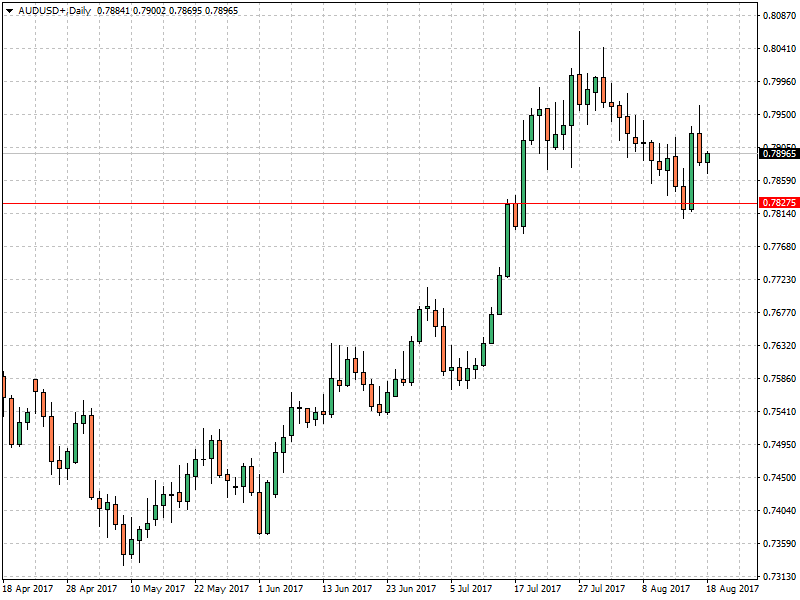
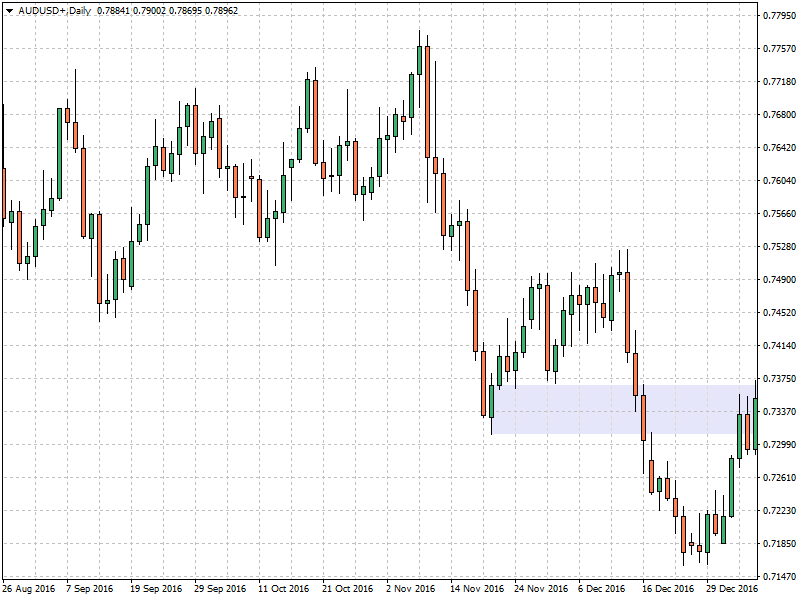
Here’s an example of traditional support line drawn at a daily close level on the AUDUSD pair:
As you can see, if you had set your stop loss to this level; or even a few pips below, you would have been stopped out. You may have even entered a short position on the apparent break and been stopped out again.
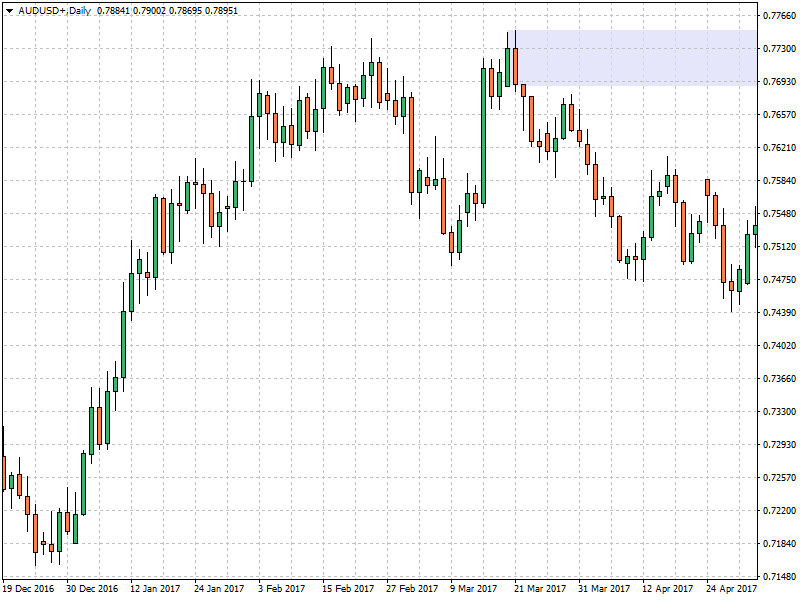
Now let’s take a look at what would have happened if you were treating support as a zone, rather than a line in the sand:
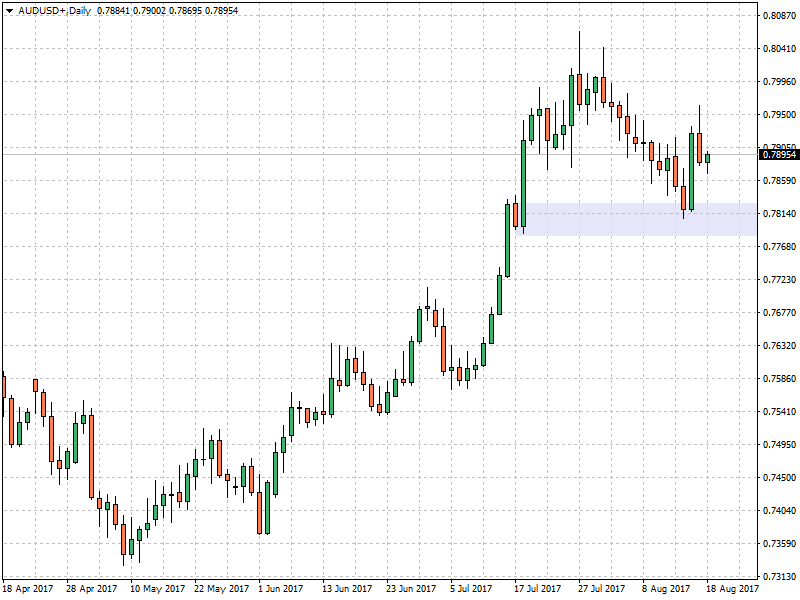
It was very likely there was going to be a reaction somewhere in this area, but pinpointing the exact price point is difficult. If you had placed your stop below the zone, you weren’t stopped out and there is no way you would have entered a short position as there was no breakout.
This is the paradox of supply and demand zones: though you are no longer attempting to identify support and resistance levels with pin-point accuracy, they actually improve your entry and stop-placement accuracy.
Drawing support and resistance zones in MT4
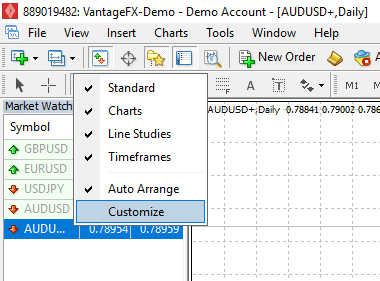
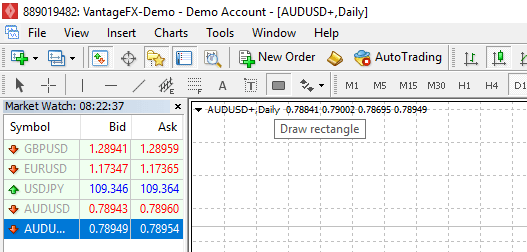
Drawing support and resistance zones in MT4 is easy, though you will have to make a quick customization to your standard toolbar. Simple right-click your standard charting toolbar and click ‘Customize’:
You’ll then want to select the ‘Rectangle’ tool and click ‘Insert’:
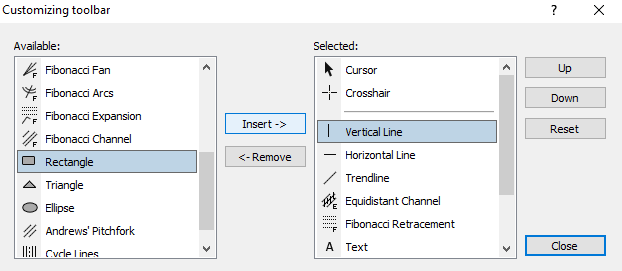
You should now have the rectangle tool available to you in your toolbar:
Tip: the default colour for your rectangles will be a dark blue, you’ll want to select a light neutral colour like the ‘Lavendar’ used above to keep your charts looking nice and clean
Now you are all set up with the rectangle tool, you can set about identifying support and resistance zones. Just like with traditional support and resistance, the basic idea, is to find areas where price has reacted before and is likely to do so again. You then mark these areas on your chart.
Generally, if drawing a resistance zone, you would extend the zone from the lower part of the candle body, all the way up to the high of the candle. Here’s an example:
Conversely, when drawing a support zone, the zone would extend from the low of the candle up to the highest part of the body:
Note this is more art than science though, there is no concrete rules when drawing zones and you may change the bounds of a resistance zone when it becomes a support zone and vice versa.
Tips for improving your trading using support and resistance zones
- Place your stop loss orders on the far side of zones to avoid getting stopped out
- Place your limit orders on the nearside of zones to avoid missing entries
- If entering a trade via market order, you can buy/sell into the zone
- For a more conservative approach, wait for a reaction out of the zone
We hope you have enjoyed this brief introduction to support and resistance zones, for more tutorials like this, tips for improving your trading and regular analysis, be sure to check out the Vantage FX blog.