USD/JPY is dropping on a risk-off sentiment related to the reported downing of two Indian planes by Pakistan in what serves as another escalation of the conflict related to the disputed Kashmir region. What’s next for the pair?
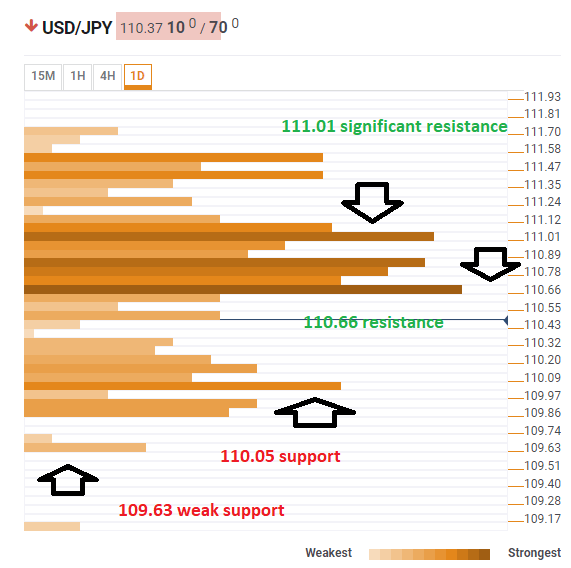
The Technical Confluences Indicator shows that dollar/yen faces fierce resistance at 110.66 which is the convergence of the Fibonacci 61/8% one-week, the Bollinger Band 15min-Upper, the BB 1h-Middle, and the Simple Moving Average 5-4h.
The way up is a minefield of resistance lines culminating in 111.01 which is where last week’s high converges with the Pivot Point one-day Resistance 1, the PP 1m-R1, and the BB 4h-Upper.
On the downside, USD/JPY has only weak support at 110.05 where we note the confluence of last month’s high with the Pivot Point one-day S2.
Even weaker support awaits at 109.63 where we find the Pivot Point one-week Support 3.
All in all, the path of least resistance is to the downside.
Here is how it looks on the tool:
Confluence Detector
The Confluence Detector finds exciting opportunities using Technical Confluences. The TC is a tool to locate and point out those price levels where there is a congestion of indicators, moving averages, Fibonacci levels, Pivot Points, etc. Knowing where these congestion points are located is very useful for the trader, and can be used as a basis for different strategies.
This tool assigns a certain amount of “weight” to each indicator, and this “weight” can influence adjacents price levels. These weightings mean that one price level without any indicator or moving average but under the influence of two “strongly weighted” levels accumulate more resistance than their neighbors. In these cases, the tool signals resistance in apparently empty areas.
