- IOT/USD MACD indicator shows sluggish market momentum.
- The daily market has found support on the SMA 20 curve.
IOT/USD has gone down from $0.277 to $0.274 so far today. This Tuesday, the price went up to $0.283, where it encountered resistance and eventually dropped down. The hourly breakdown shows us that the price fell to $0.271, where it found short-term support and went up to $0.277 to close out Tuesday. Since then, the market experienced four straight bearish hours to drop down to $0.274. The market has found support on the 20-day Simple Moving Average (SMA 20) curve.
IOT/USD daily chart
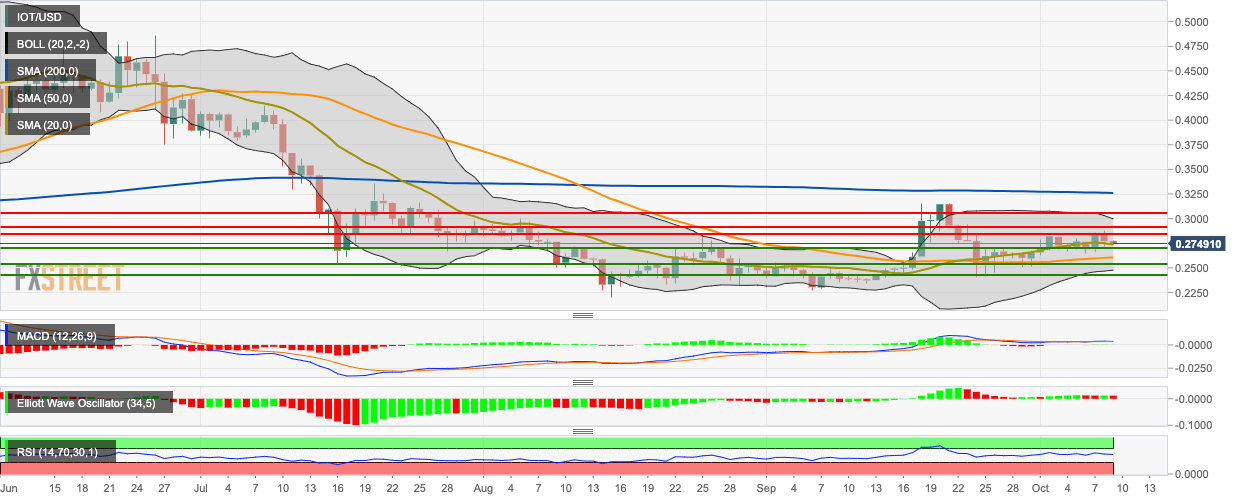
IOT/USD is trending above the SMA 20 and SMA 50 curves. The 20-day Bollinger jaw has narrowed, indicating decreasing market volatility. The Moving Average Convergence/Divergence (MACD) indicator shows that the market is going through sluggish momentum. The Elliott Oscillator has had a bearish session, while the Relative Strength Index (RSI) indicator is trending around the neutral zone.
