- IOT/USD is floating below the SMA 20, SMA 50 and SMA 200.
- The MACD indicates decreasing bearish momentum.
IOT/USD daily chart
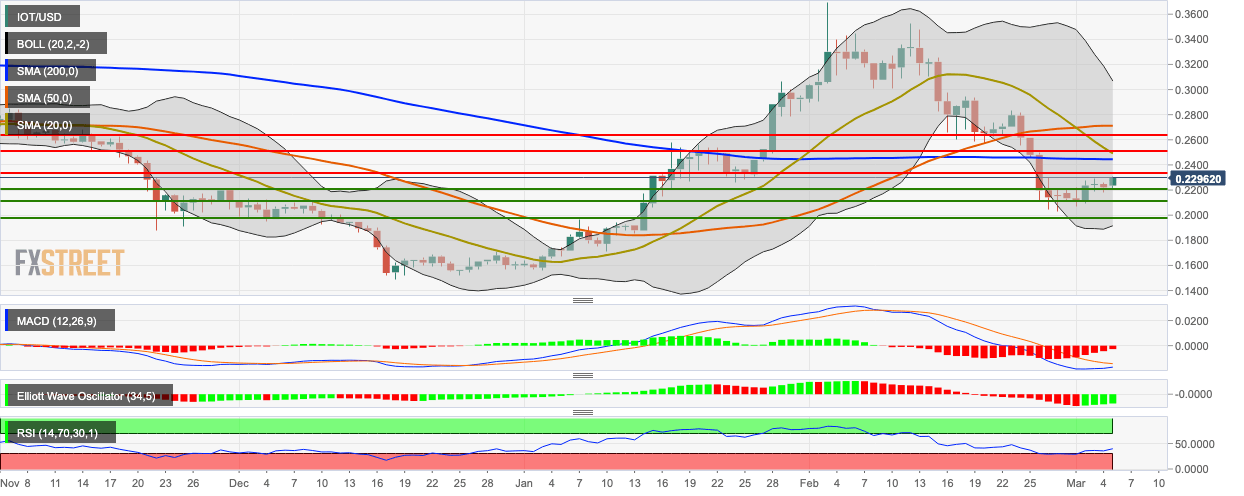
IOT/USD went up from $0.224 to $0.229 in the early hours of Thursday, following a bearish Wednesday. The price is hovering below the SMA 20, SMA 50 and SMA 200 curves. The SMA 200 is about to cross over the SMA 20, which is a heavily bearish sign. The MACD indicates decreasing bearish momentum, while the Elliott Oscillator has had four straight green sessions. Over the last four days, the RSI indicator has jumped from the edge of the overbought zone to 42.85.
