- IOT/USD bulls ran out of steam at the $0.30 level.
- The SMA 20 curve is about to crossover the SMA 200 to chart the golden cross.
IOT/USD daily chart
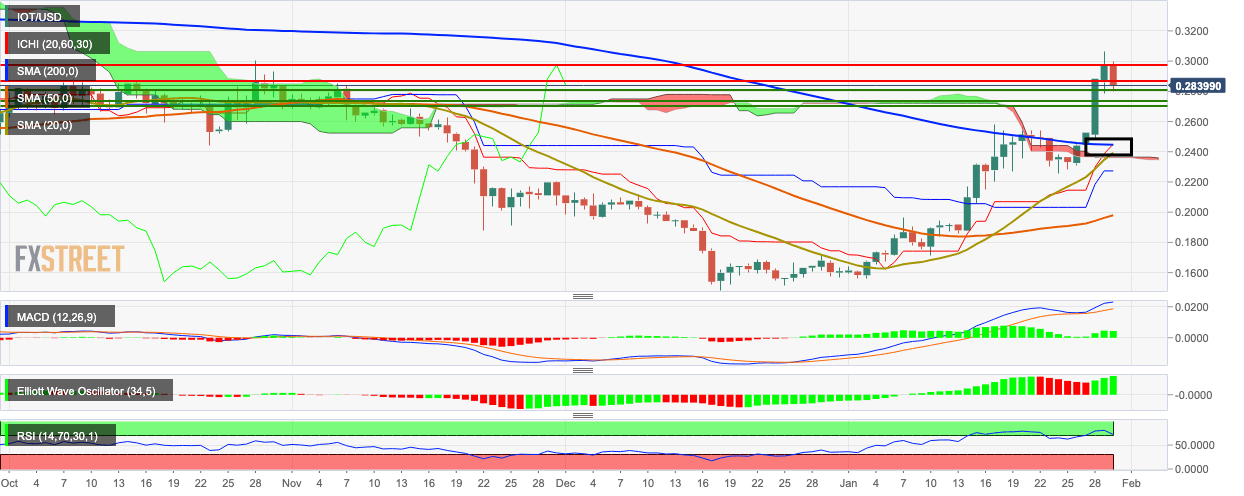
After four consecutive bullish days, IOT/USD ran out of steam at the $0.30-level and fell dramatically to $0.284. The RSI indicator was hovering inside the overbought zone, so a bearish correction was inevitable. However, technical analysis shows that overall market sentiment is still bullish. The Elliott Oscillator has had three straight green sessions, while the MACD indicator shows sustained bullish momentum. More importantly, the SMA 20 curve is about to cross over the SMA 200, to chart the golden cross pattern, which is one of the most bullish signs out there. So, while the market is going through a temporary bearish correction, expect the price to go up again soon.
