One of the things we tell our traders to do at the end of the week is to examine the Weekly charts, to reflect on the weeks movements and tie in with your Daily chart analysis.
At the end of this week we looked over the markets and spotted a significant price action event that had occurred on the S&P500.
Basically what has happened is the Weekly candle has closed into all-time highs with an aggressive bullish close. In fact the close couldn’t be more aggressive since the close of the weekly candle is the same as the high.
Firstly for the Newbs, What is the S&P?
The S&P 500 is an index; it represents 500 of the top ranking US stocks. It’s designed to be a leading indicator risk/return attitude of the market.
The technical guys use the S&P as a market risk appetite barometer.
When the S&P500 is gaining value it means that the market has a high level of risk appetite, investors feel good about the currently economic situation and are looking to invest money into high yielding currencies.
If the S&P500 is dropping, it’s an indication that there is a lot of fear and uncertainty in the markets. Investors pull out their money to try avoid taking losses.
The situation
Here is a view of the current Weekly Chart.
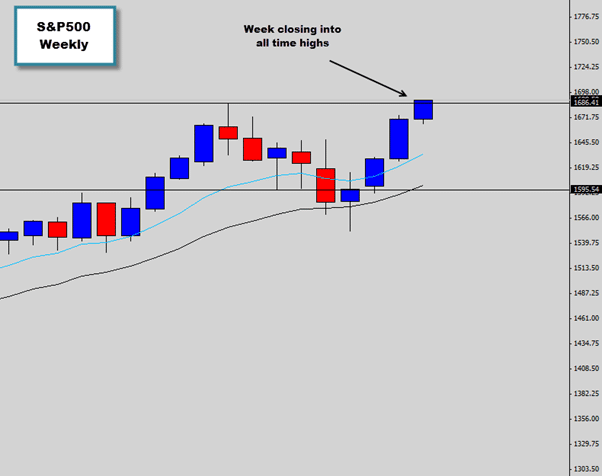
As we mentioned about the weekly chart has move over the previous high level water market of the S&P and closed into all-time highs. The DOW Jones, which is another US stock index, is in a similar situation.
What does this mean?
As we discussed above, a bullish S&P is a good indicator that the market has a high level of risk appetite and investors are looking for places to put their money which will give them good ROI. This is going get a lot of attention from the industry if the S&P continues to climb into these higher prices.
When the market is in a state of risk appetite, it’s reflected in the Forex market also.
Higher yielding currencies like the EUR, GBP, AUD, NZD, CAD will generally rise in value as the ‘risk on’ feel of the market encourages bullish sentiment of these currencies.
This week we’ve already had some bullish price action setups develop in these markets and seen good bullish response and follow through.
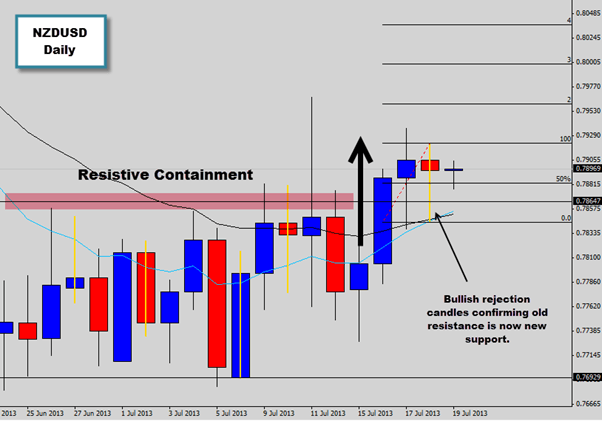
The NZDUSD Daily chart above from this week shows that the NZDUSD has broken out of some heavy consolidation, retested the breakout level and confirmed it has new support by printing two bullish rejection candle signals.
It’s the lower wicks on these candles that communicate the bullish reaction with the new support level has price interacts with it. We’ve already seen some bullish follow through on this setup and anticipate further movement upwards next week.
Another bullish setup which formed on the GBPUSD this week”¦
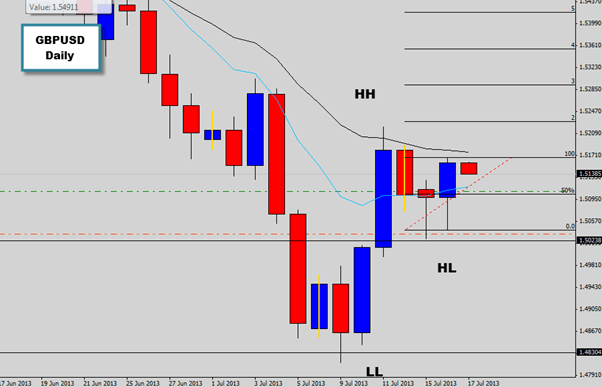
Two bullish candles formed off a support level which made a new higher low in this market. We were able to grab the retracement entry on the second candle; it was a much more convincing bullish signal due to the aggressive bullish close.
This setup has seen an excellent bullish response in the market and bullish momentum looks nice and strong going into next week.
Check out the gold chart below.
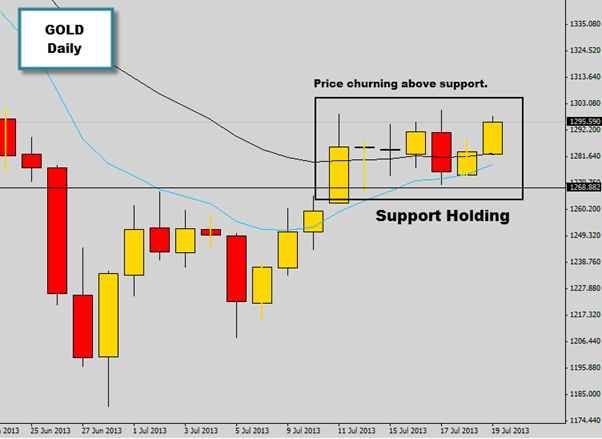
Risk appetite may even promote bullish activity in the Gold market.
As market participants dump the USD to put their money in higher yielding currencies the USD will weaken. This may pave the way for gold to move higher.
At the moment gold is stuck in consolidation, but a key level that was breached by the bulls recently is now holding as support, so we could very week see that break to the upside.
However,
The S&P may not be able to maintain higher prices next week and this could be a very bearish signal to the market. If the S&P does sell off because the bulls are exhausted and there is no pressure left to keep going into those new highs, then the sell off could be quite aggressive.
Generally when the S&P sells off, it’s generally an aggressive frenzy when all the investors try to pull out in fear, trying to avoid losses from the collapsing market. This type of sell off has a cascading effect through the market which fuels even more bearish activity. What goes up must come down.
So the price action on the S&P next week will be high interested events, so it’s a good idea to keep an eye and see how the price action unfolds next week.
Guest post by Graham Blackmore from www.dnbforexpriceaction.com
