- KAVA got a lot of interest after Binance announced a trading competition featuring the digital asset.
- KAVA/USD is trading inside a strong daily uptrend.
KAVA is currently getting sold at $1.16 after a significant bounce from $1.03. The entire crypto market suffered a slight drop but recovered. Bulls have successfully defended the daily 12-EMA at $1.05 and are eying up the $1.197 high established on June 10.
KAVA/USD daily chart
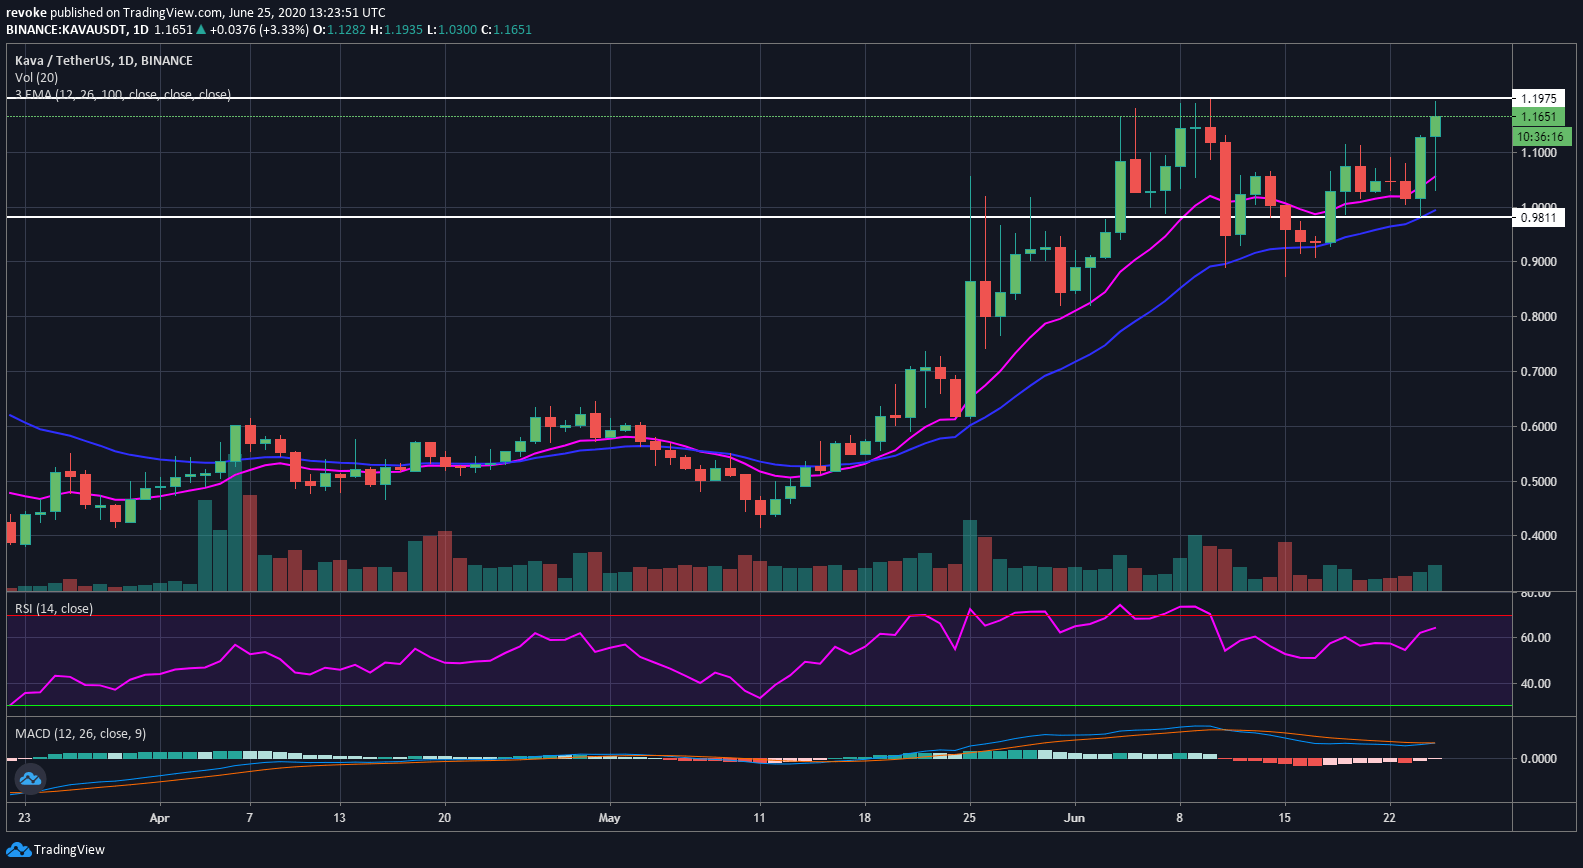
KAVA touched $1.193 already and it is still trading at $1.17 trying to crack the $1.197 high. The daily MACD is on the verge of a bull cross and the trading volume is increasing. The next resistance level would be at $1.28, the high of February 12. The daily RSI is dangerously close to the overbought level but there is still some space for the buyers to climb above the last high.
KAVA/USD 4-hour chart
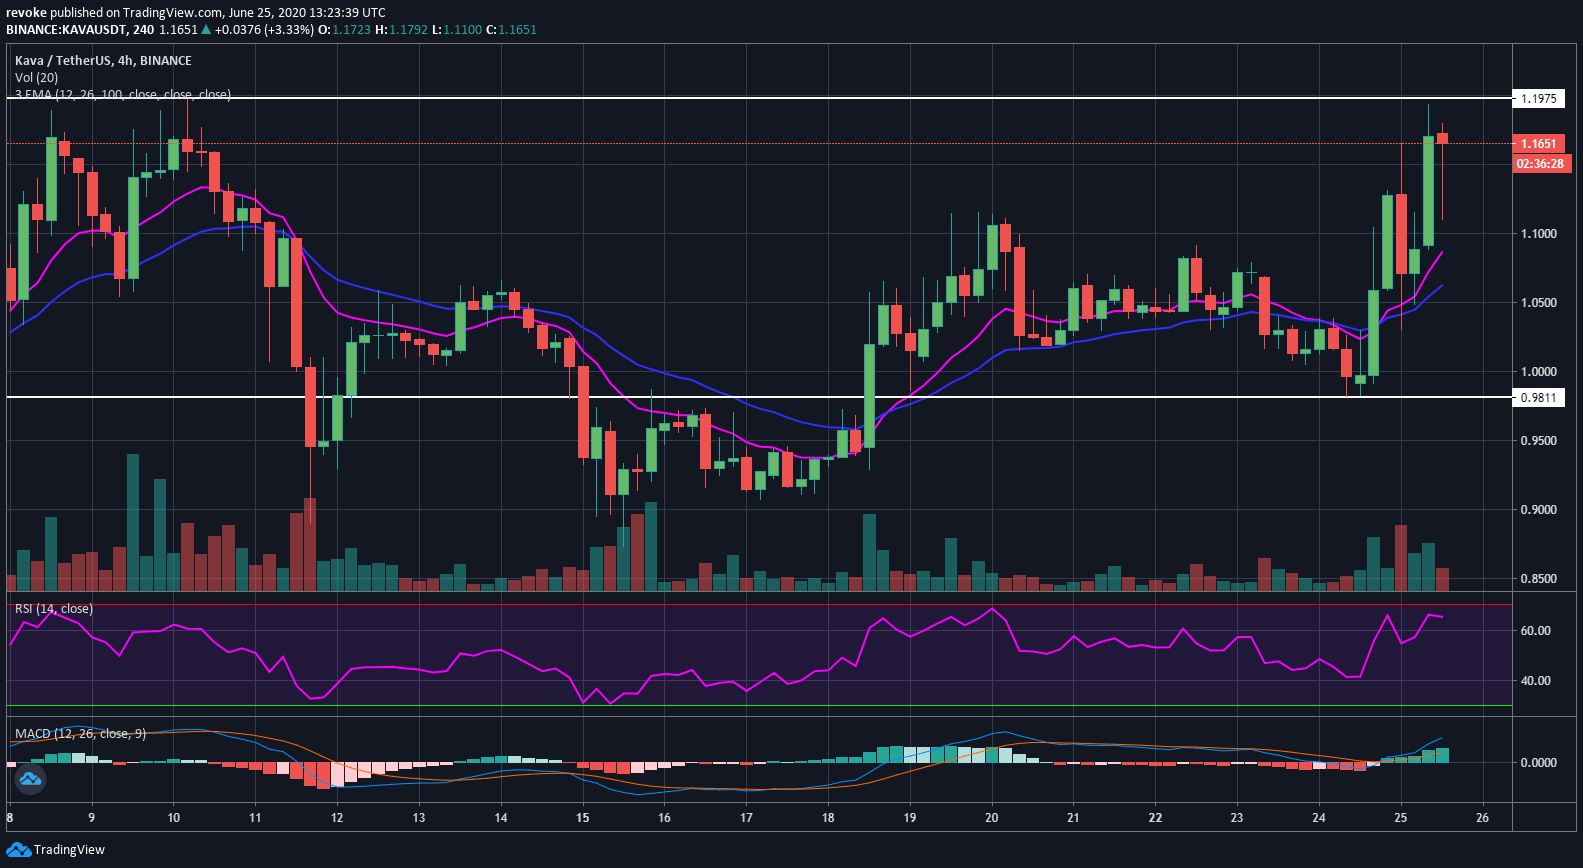
KAVA is trading above the 12-EMA and the 26-EMA which have crossed bullishly. There is a clear increase in trading volume which indicates the bullish momentum is strong. The RSI is also close to being overextended, but the MACD is positive.
