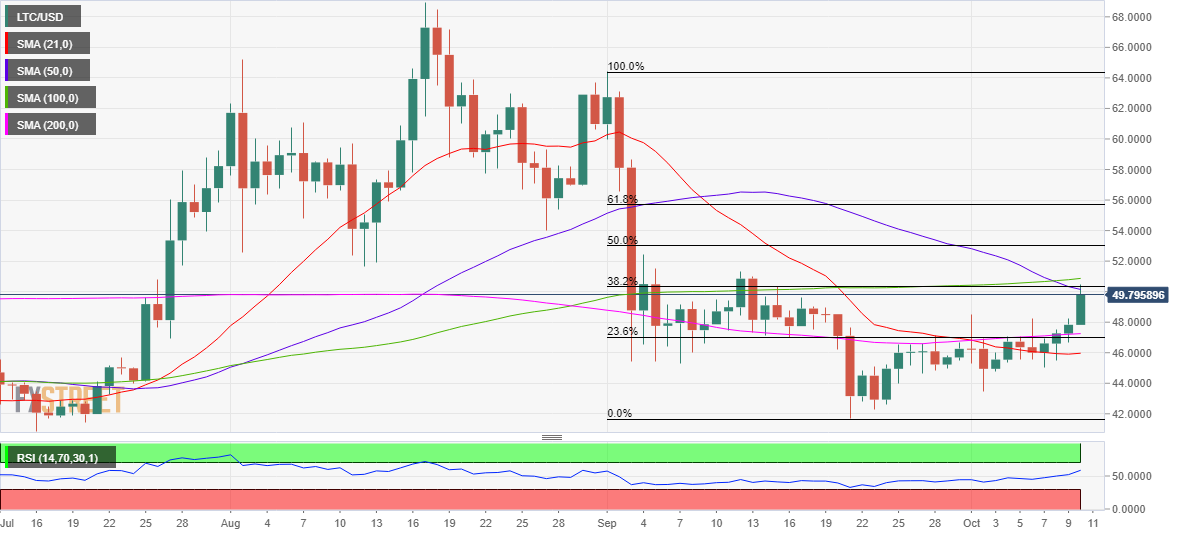
- LTC/USD battles a cluster of key resistance levels at $50.
- Daily RSI inches higher above the midline, more gains likely?
- 200-DMA to offer support to LTC bulls in the near-term.
Following the relentless advance for four straight sessions, Litecoin (LTC/USD) buyers are facing some exhaustion at $50 levels on Saturday.
The resistance zone is a strong confluence of the bearish 50-day moving average (DMA), horizontal 100-DMA and 38.2% Fibonacci Retracement level of the sell-off from the September 1 high of $64.39 to the September 21 low of 41.67.
Only a decisive break above the aforementioned level would help accelerate the recent gains towards the next relevant hurdle at the 50% Fibonacci Retracement of the same decline, which is at $53.07.
The 14-day Relative Strength Index (RSI) holds firmer above the midline, leaving scope for more gains. However, it could probably be tough for the bulls to extend their control.
To the downside, the intersection of the 200-DMA and 23.6% Fibonacci Retracement level just above the $47 mark could act as strong support.
Should the bears manage to clear that level, the 21-DMA cushion at $45.96 could get tested.
LTC/USD: Daily chart
LTC/USD: Additional levels to consider
