- Battle lines well-defined for the LTC/USD traders on the daily chart.
- A potential Doji candlestick charted with neutral RSI.
- Litecoin awaits a strong catalyst to determine the next direction.
Following Friday’s solid rebound from multi-day lows of $123, Litecoin (LTC/USD) lacks a follow-through bias, as the bulls and bears get into a tug-of-war this Saturday.
At the press time, the digital asset trades little changed on the day near the $137 region, unable to find a clear direction while awaiting a fresh impetus to break through the recent trading range.
LTC/USD: Range play likely to extend
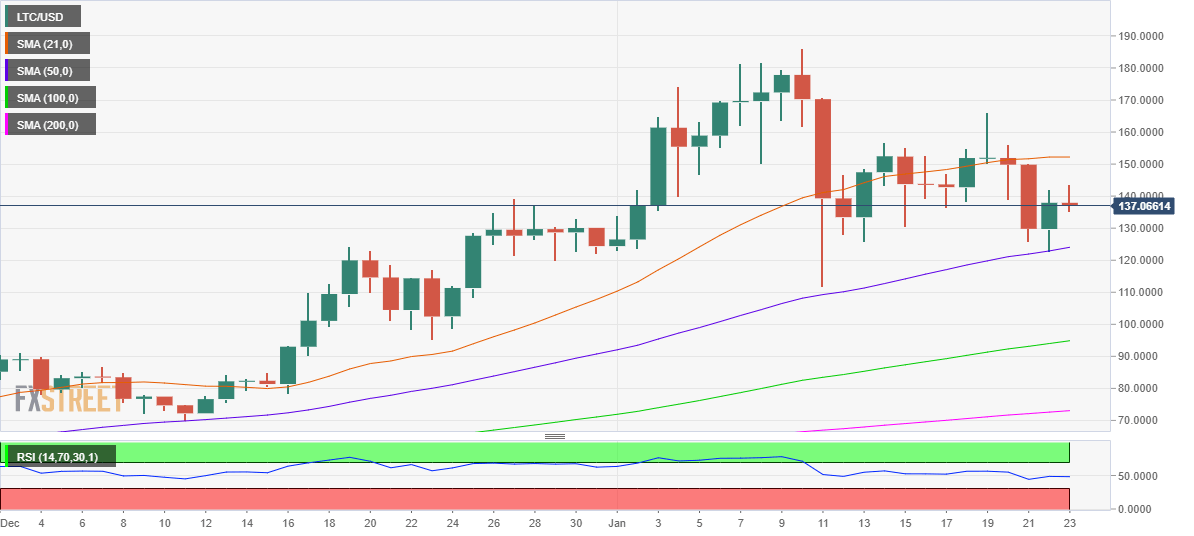
LTC/USD: Daily chart
LTC/USD has formed a potential Doji candlestick on the daily timeframe after Friday’s bounce, suggesting that the price in search of a clear direction for its next move.
The price wavers between the 21-day moving average (DMA) and 50-DMA, with the 14-day Relative Strength Index trading flat at the midline. The technical picture, therefore, points to indecision.
Only a convincing break above the 21-DMA barrier at $152 could revive the recovery momentum from eleven-day lows.
Meanwhile, the sellers need acceptance below the 50-DMA at $124 to resume this week’s downward spiral from near $166 levels.
Should the selling pressure intensify, a breach of the $100 level becomes inevitable. The next significant support is aligned at the upward-sloping 100-DMA at $94.87.
LTC/USD: Additional levels to consider
