- LTC is up 10% in the last 48 hours.
- The current uptrend could be stopped by the resistance level at $50.87.
- LTC/USD has experienced a significant surge in trading volume on most exchanges.
LTC/USD daily chart
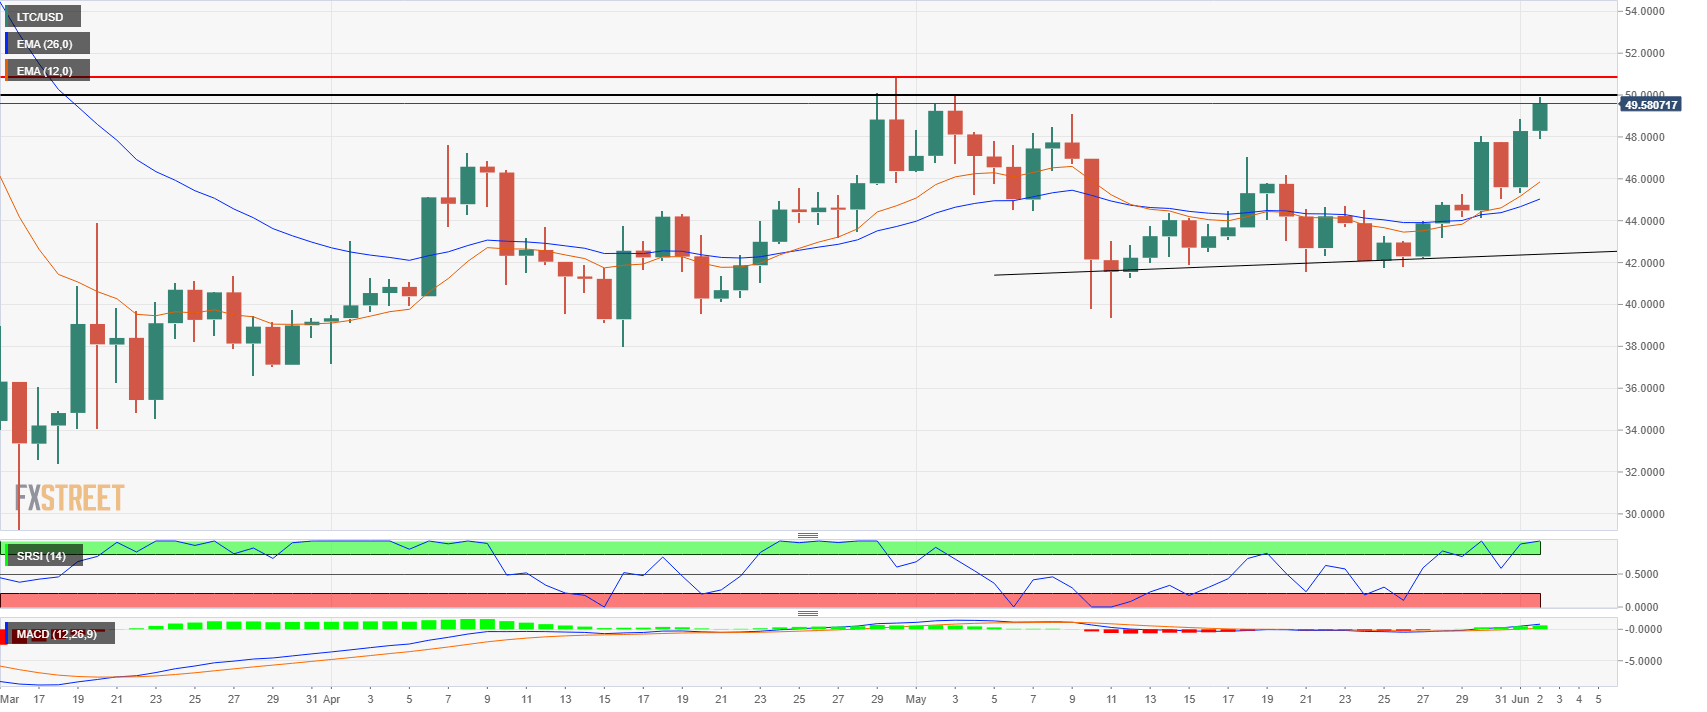
After a clear bull break on May 30, LTC/USD is now trading at around $49.58, inches away from the $50 resistance level, and the crucial $50.87 resistance point set on May 4. Bulls managed to break above the daily 12-EMA and the 26-EMA which also crossed bullishly.
Rejection of $50.87 can still hinder the current uptrend. So far, Litecoin has only been following the movement of Bitcoin and Ethereum, and it’s still at their mercy. A clear break above $50.87 can quickly push LTC up to $60.
LTC/USD 4-hour chart
-637266996323553231.png)
Litecoin is inside a clear and robust 4-hour uptrend where bulls can look at all the higher lows as support levels. The nearest support level, however, is the 12-EMA currently set at $47.91, followed by the 26-EMA at $46.84. The RSI is overextended and will need to cool off eventually, but it won’t necessarily stop the bulls from breaking $50.
LTC/USD technical levels
