- Litecoin had its 8th birthday on October 13.
- The coin’s movements are limited by the boundaries of a tight range.
Litecoin is stuck in a depressingly narrow range limited by $58.00 on the upside and $53.00 on the downside. At the time of writing, LTC/USD is changing hands at $56.27, the coin has barely changed both since the beginning of the day and on a day-on-day basis despite mild recovery among other top altcoins.
The 6th largest digital asset with the current market value of $3.6 billion bottomed at $50.39 on September 26 and has been moving sideways ever since. Litecoin’s daily trading volume has settled at $2.2 billion.
Notably, the coin celebrated its eighth anniversary on October 13. According to the creator of the project, the network handled transactions worth over $500 billion since its inception.
«Happy 8th birthday to Litecoin! Litecoin network has been up and running continuously for the past 8 years with zero downtime. And in that span of time, over $500,000,000,000 worth of LTC have been transacted. Looking forward to the next 8 years and more! » he tweeted.
LTC/USD, the technical picture
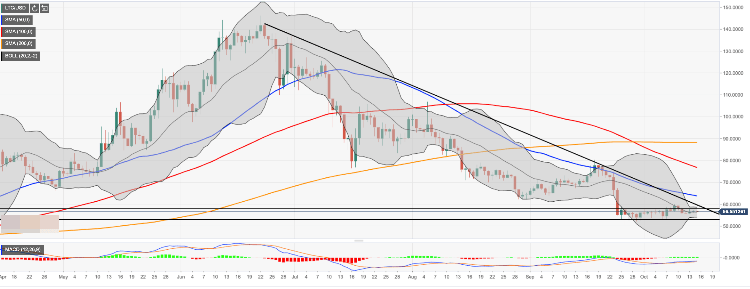
Looking technically, LTC/USD attempted to break free from the range and hit $60.12 on October 9. However, the lack of follow-through pushed the price back inside the range. A cluster of strong resistance levels located above the current price includes the above-mentioned upper line of the current channel, the upper line of the Bollinger Band on a daily chart ($58.60), and the long-tern sloping trendline from June 23 high at $59.60.
Also, psychological $60.00 followed by the recent recovery high $60.12 may serve as a backstop for the recovery. We will need to see a sustainable move above this area for the upside momentum to gain traction. Once this happens, LTC/USD may aim at the next target of $63.80 (SMA50 (Simple Moving Average on a daily chart).
On the downside, the strong support is created by $53.00 with the lower boundary of the above-said channel located at $52.80. Once it is out of the way, the sell-off is likely to gain traction with the next focus on $50.39 (September 26 low) and psychological $50.00.
LTC/USD, daily chart