- LTC/USD touched ground above daily SMA50 before sellers popped in
- The head-and-shoulder pattern implies high risks of the downside correction.
Litecoin had a spectacular start of the week and for a fraction of time, moved above daily SMA50 for the first time since June 11. At the time of writing, LTC/USD is changing hands at $43.50, having gained nearly 2% on a day-to-day basis. The coin takes seventh place in the global cryptocurrency market. The total value of all LTC in circulation reached $2.8 billion, while an average daily trading volume is registered at $1.7 billion.
LTC/USD: Technical picture
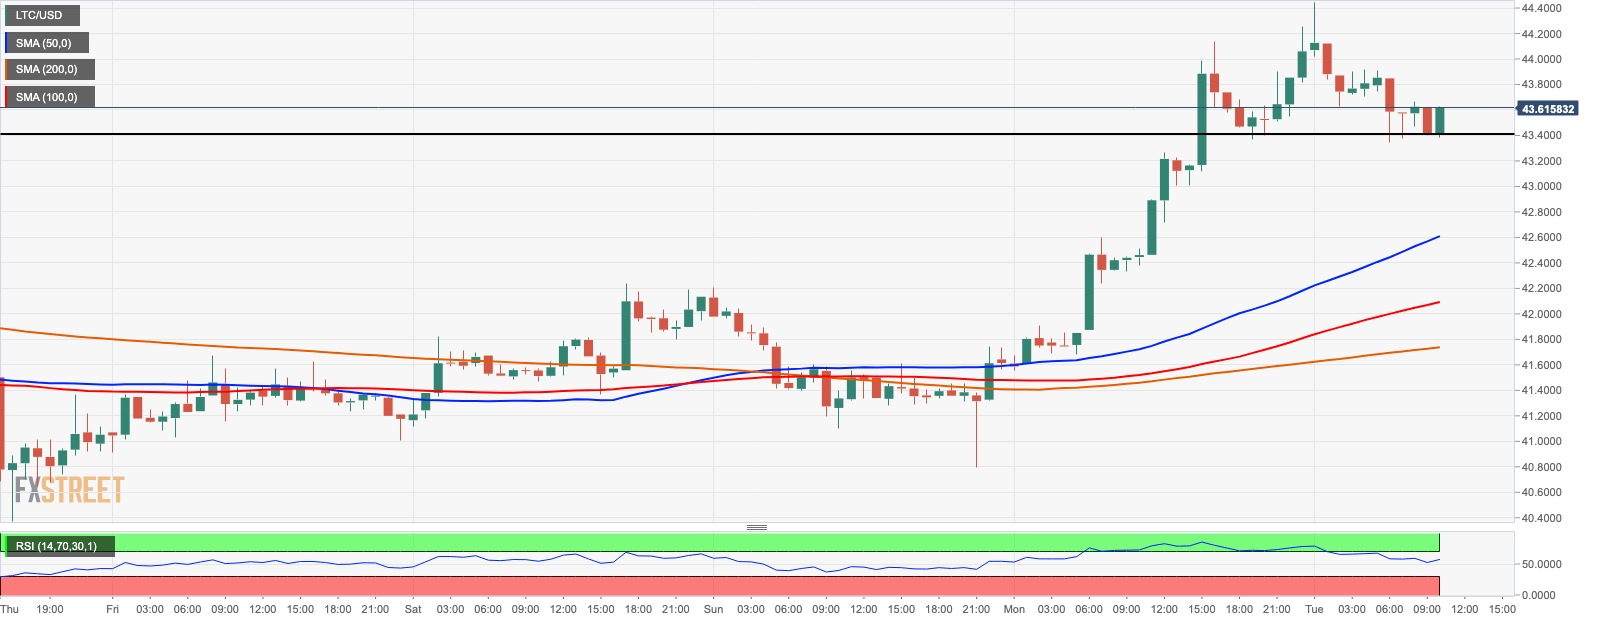
On the intraday charts, LTC/USD has created a head-and-shoulders pattern, which is a precursor to the downside correction. If the price moves below the neckline at $43.40, the bearish momentum may gain traction with the next focus on $42.60. This support is reinforced by 1-hour SMA50. Once it is out of the way, the sell-off will continue towards 1-hour SMA100 at $42.00 and SMA200 at $41.70.
LTC/USD 1-hour chart
The initial recovery is capped by 4-hour SMA100 at $43.70. Once it is out of the way, the upside is likely to gain traction with the next focus on $44.00 strengthened by the above-mentioned daily SMA50, and the recent recovery high at $44.44. A sustainable move above this area is needed to create an upside momentum and bring $45.00 into focus. Meanwhile, the ultimate resistance comes with daily SMA200 on approach to psychological $50.00.
LTC/USD daily chart
-637297151743994020.png)
