- Lower lows and lower highs within a descending have seen Litecoin test the support at the 23.6% Fib level.
- The trends shown by the MACD and the RSI show that the price has found a short-term bottom.
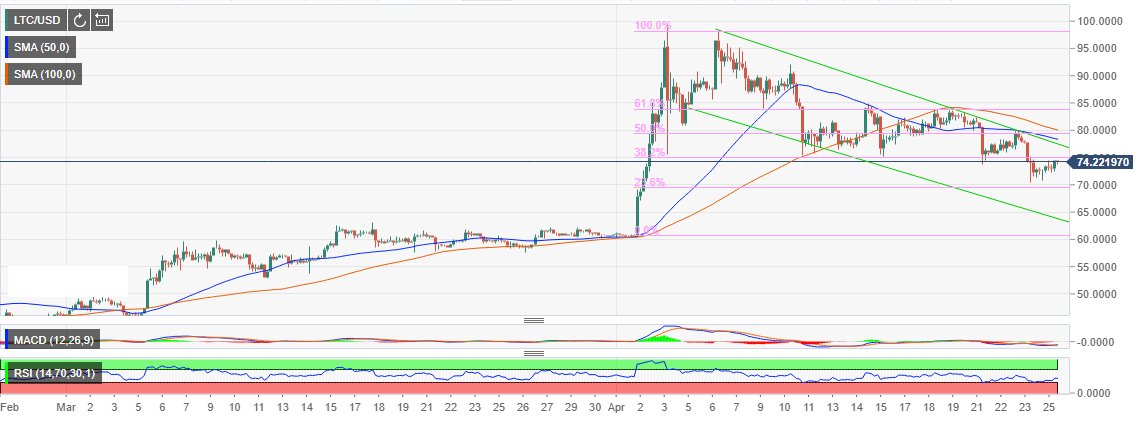
Litecoin is trading below the moving averages after extended the declines from the highs achieved in April. Lower lows and lower highs within a descending have seen Litecoin test the support at the 23.6% Fib level between the last drop from $98.1092 to a low around $60.8035 close to $70.00.
Meanwhile, attempts to beat the bearish pressure in the three weeks have failed miserably. At the time of writing Litecoin is trading at $74.36 while battling the resistance at the 38.2% Fibo. LTC/USD needs to zoom above this hurdle in order to enter a bullish zone between $75 and $80.
The trends shown by the MACD and the RSI show that the price has found a short-term bottom. The RSI touched the oversold but recovered to 47.05. Although it is unable to correct above the average at 50.00 the ranging motion means that traders can expect LTC/USD to say above the key support at $70.00 and the immediate resistance at $75.00.
LTC/USD 4-hour