- Litecoin price could drop towards the $125 support wall.
- IOMAP shows LTC price sits on strong support.
Litecoin price has been on a downward trend since Saturday, where it fell by approximately 4.6% from around $145.56 to close the day at around $138 on Monday. LTC had previously tanked to $107 from around $145 between July 04 and July 20. During this bearish trend, LTC managed to flip the 20-day Simple Moving Average (SMA) from support to resistance and reversed the market momentum from green to red.
Litecoin Price Retreats Below The $140 Mark
Before the recent bearish rally, Litecoin price had traded in the green for 10 consecutive daily sessions between July 21 and July 30 gaining roughly 35% when LTC jumped from $107 to $145 going above the $140 psychological level. During this rally, the digital asset flipped the 20-day and the 50-day SMAs from resistance to support.
The parabolic SAR remains positive while the Moving Average Convergence Divergence Indicator (MACD) remains above the signal line in the positive region indicating a sustained bullish momentum as seen on the daily chart.
Litecoin Price (LTC/USD) Daily Chart
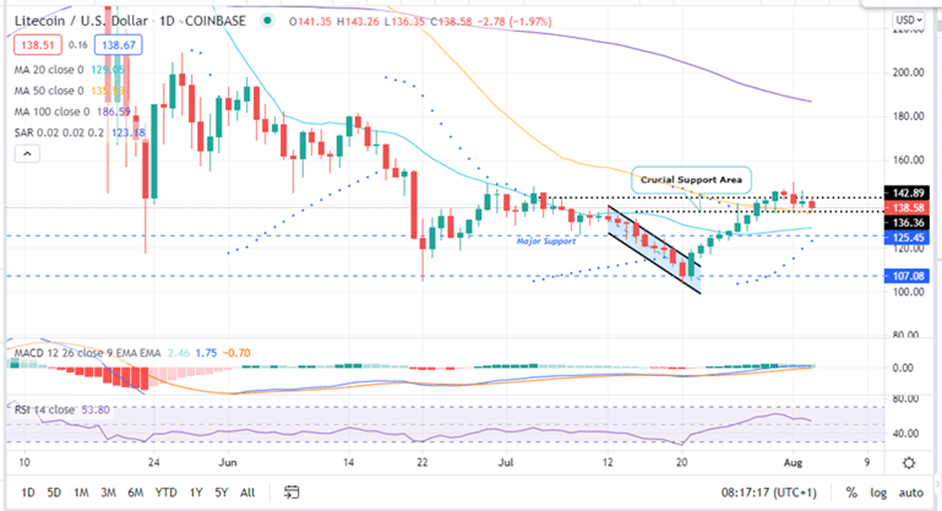
At the time of writing LTC was exchanging hands just below the $140 psychological level at around $138.54 on most crypto exchanges. The immediate support is found at $136 where it coincides with the 50-day SMA. Note that a daily closure below this level will push the Litecoin price further down towards the 20-day SMA currently at $129.
LTC Price Sits on Strong Support
Litecoin has healthy support around the $125 zone. This support level needs to be defended to prevent the LTC price from dropping even further.
According to the In/Out of the Money Around Price (IOMAP) model by IntoTheBlock, this support zone is relatively strong. It lies within the $73 and $125 investor cluster where roughly 661,000 addresses hold approximately 6.22 million LTC.
This support appears strong enough to absorb any further selling pressure. Therefore, the bulls can bank on this support to re-start the recovery leg.
LTC/USD IOMAP
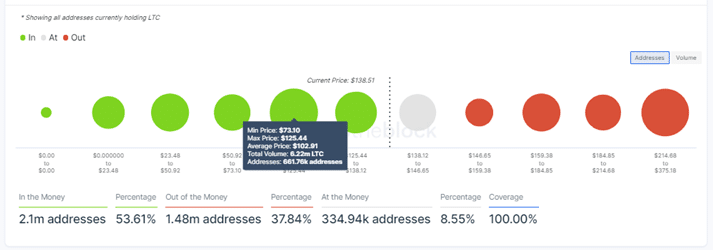
The IOMAP model also shows that the immediate resistance to Litecoin price currently sits within the $146 to $159 price range. At this range, only about 2 million LTC are being held by roughly 170,000 addresses.
This should not be a big hurdle to bulls who wish to push LTC To the $160 psychological level.
Note that of Litecoin remains above the descending parallel channel price range and above the 50-day SMA, it will bolster bulls to reverse the bearish momentum to push the LTC price above the $145 or $150 levels respectively.
- Are you seeking to trade cryptocurrency? Our crypto brokers guide might be helpful.
Looking to buy or trade Litecoin now? Invest at eToro!
Capital at risk
