Litecoin price failed to overturn the downward rally as it stretched the bearish leg around the $103 level. LTC is currently trading at $113 against the dollar and gained approximately 8.6% over the last 24 hours. Litecoin is currently bullish but recovery momentum might not hold for long.
What do the Litecoin crypto signals tell us?
Litecoin Price Technical Outlook
Litecoin has traded below the 20-day SMA (Simple Moving Average) since July 12 during which LTC declined 19% to the current price at $113. Before this, Litecoin was hovering between $136 and $150. At the moment, there is no telling which direction the asset will take as it sends mixed technical signals.
For example, the parabolic SAR indicator flipped from positive to negative on July 19. Parabolic SAR is a technical indicator that uses a stop and reverse (SAR) method to determine which direction the trend and price of an asset takes.
It appears as a series of dots above (during a downtrend) or below (during an uptrend) the asset’s price. Thus, the appearance of dots above the LTC price daily chart illustrates that bears are still in control and that the bearish run is set to continue.
At the same time, the Moving Average Convergence Divergence (MACD) indicator adds credence to the continued bearish outlook with it continued movement below the signal line in the negative region. These indicators tell us that LTC could drop more.
If this happens, Litecoin price could re-test the $100 or even $75 support levels.
Litecoin Price (LRC/USD) Daily Chart
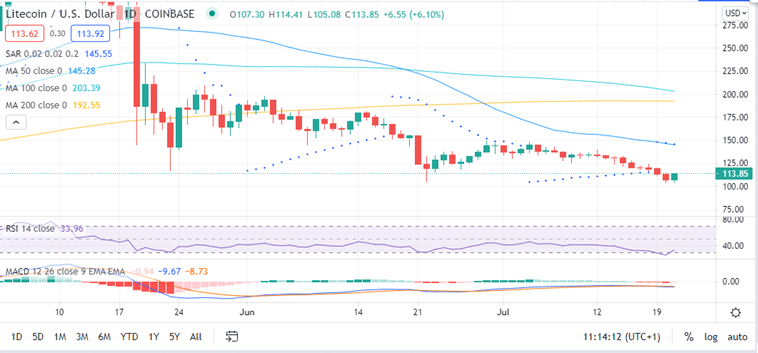
On the flip side, the appearance of a bullish candle points to a trend reversal. This is accentuated by the Relative Strength Index (RSI) which has moved sharply upwards from the oversold region. This kind of movement indicates that the current bullish momentum is strong and may continue in the near term.
Note that a daily closure above the $120 resistance level could bolster Litecoin bulls to overcome the 20-day SMA resistance ($130). If this happens, it could see LTC explore levels around $150.
- Are you new to crypto trading? This best cryptocurrency to buy is a good start.
More From On-Chain Metrics
On-chain metrics by Santiment show that Litecoin price network activity has been increasing since July 15. However, the number of active addresses decreased from around 430,000 on July 19 to 388,000 on July 20. A decrease in the number of active addresses is usually a bearish sign.
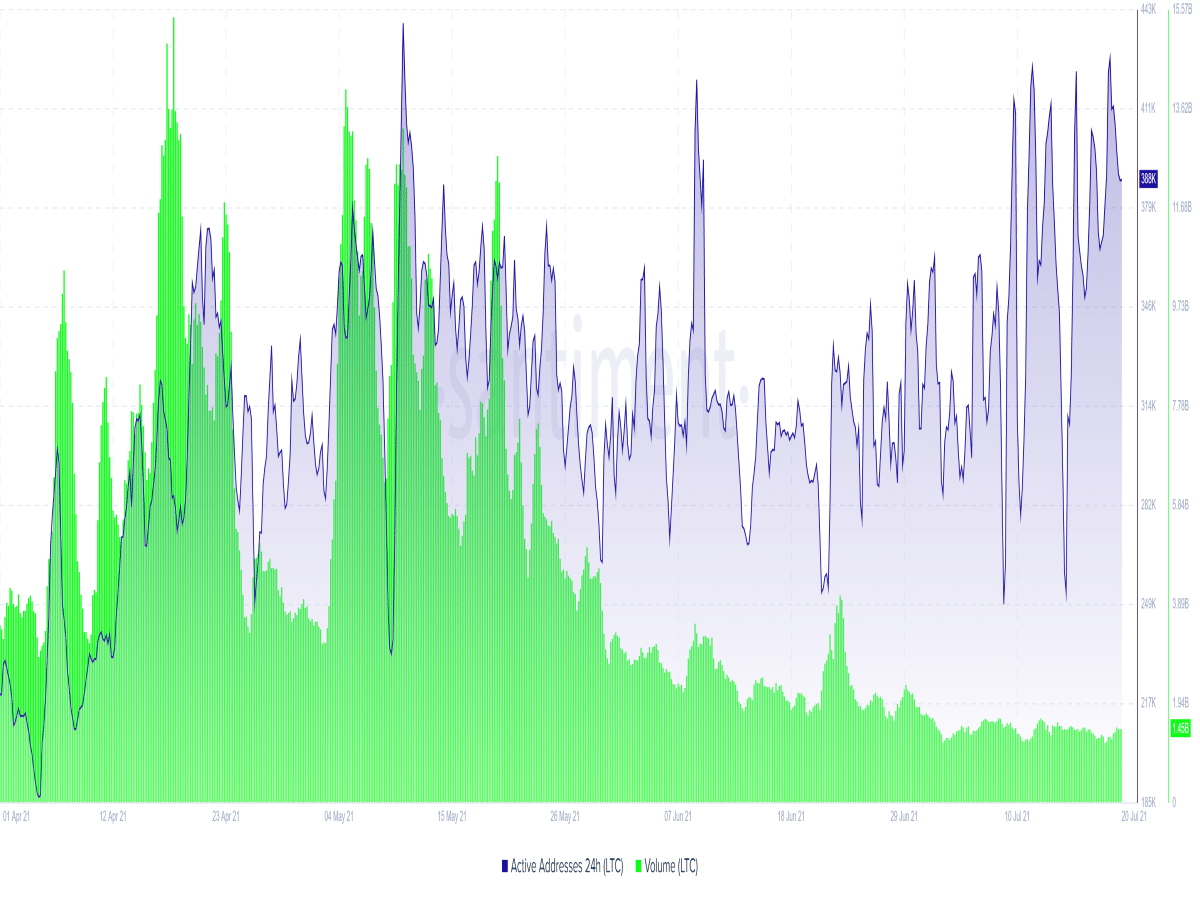
On the other hand, the same on-chain metrics show that the volume of LTC traded has decreased significantly since May 20. However, it has increased from around 1.12 billion on July 19 to 1.47 billion on July 20. This is an indication of increasing bullish pressure.
Bottom line
From the technical and fundamental analysis, its is not clear the direction Litecoin price might take. It would be better to wait before making a trading move.
Looking to buy or trade Litecoin now? Invest at eToro!
Capital at risk
