- From Saturday, March 7 to Wednesday, March 11, LTC/USD fell from $63.47 to $48.69.
- The RSI indicator has dipped into the oversold territory.
LTC/USD daily chart
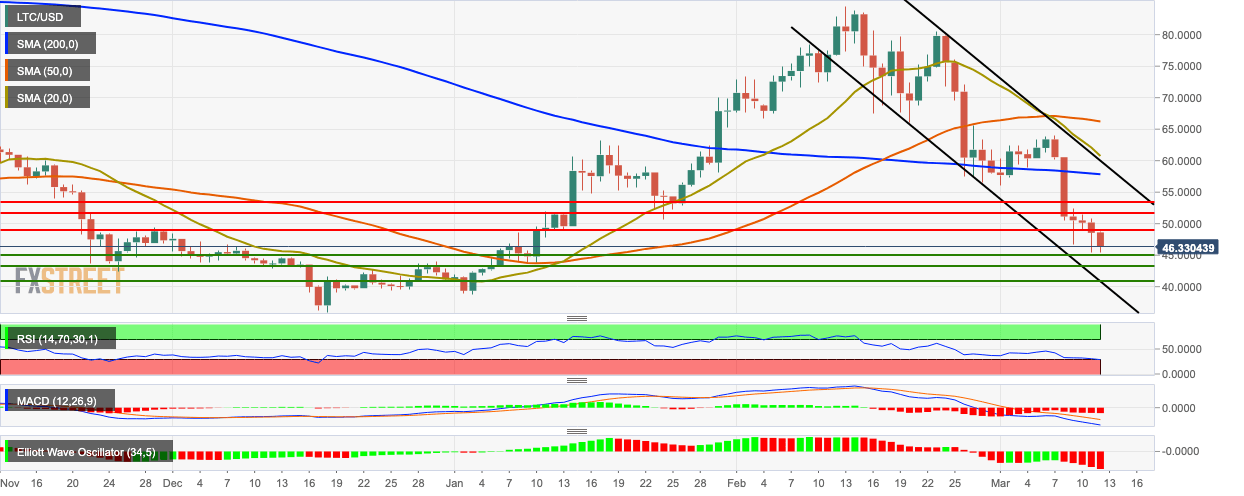
LTC/USD is trending in a downwards channel formation in the daily chart and has had six consecutive bearish sessions from Saturday, March 7 to this Thursday. From March 7 to Wednesday, March 11, LTC/USD fell from $63.47 to $48.69. The price has fallen further to $46.20 in the early hours of Thursday. The RSI indicator has dipped into the oversold territory indicating upcoming bullish correction. The MACD shows sustained bearish momentum, while the Elliott Oscillator has had five straight red sessions.
