- LTC/USD went up from $90.50 to $91 in the early hours of Wednesday.
- Moving average convergence/divergence (MACD) shows slight bullish momentum.
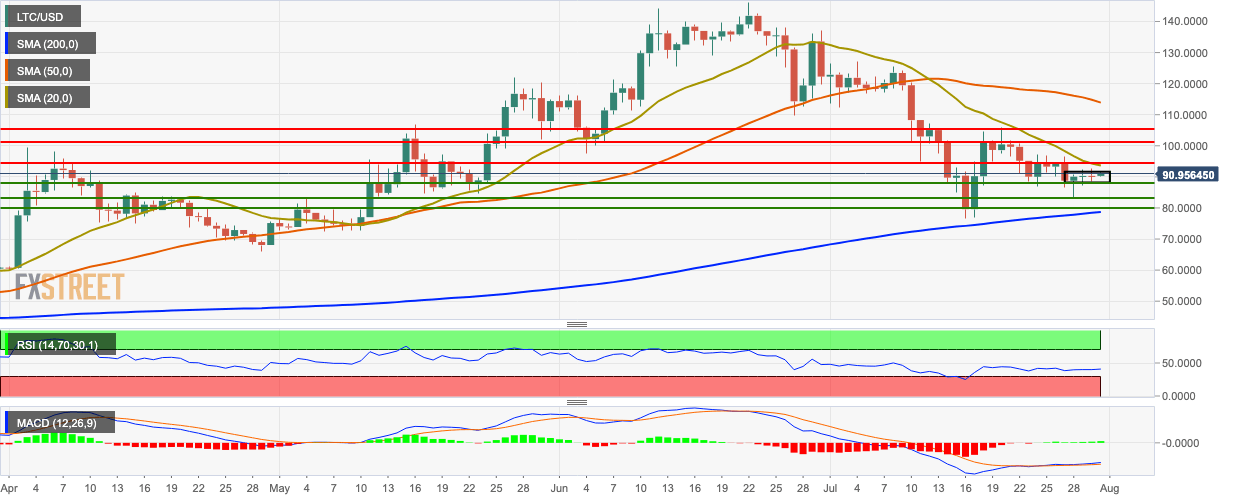
LTC/USD went up from $90.50 to $91 in the early hours of Wednesday. The four latest sessions are trending in a flag formation. The hourly price chart shows that the price went up to $91.85, where it met resistance and fell to $90.15. After that, it went up again to $91.56, where it met resistance again and fell to $91.
LTC/USD daily chart
The LTC/USD daily chart is trending below the 50-day simple moving average (SMA 50) and SMA 20 curves. The SMA 20 curve has taken a sharp turn and is trending close to the price. The relative strength index (RSI) indicator is trending around 41.25. The moving average convergence/divergence (MACD) shows slight bullish momentum.

