- LTC/USD had a bearish start to Thursday, as price consolidates below $44.
- The Elliott Oscillator shows six straight red sessions.
- LTC/USD faces strong resistance levels at SMA 50, $44.50 and $45.80.
LTC/USD daily chart
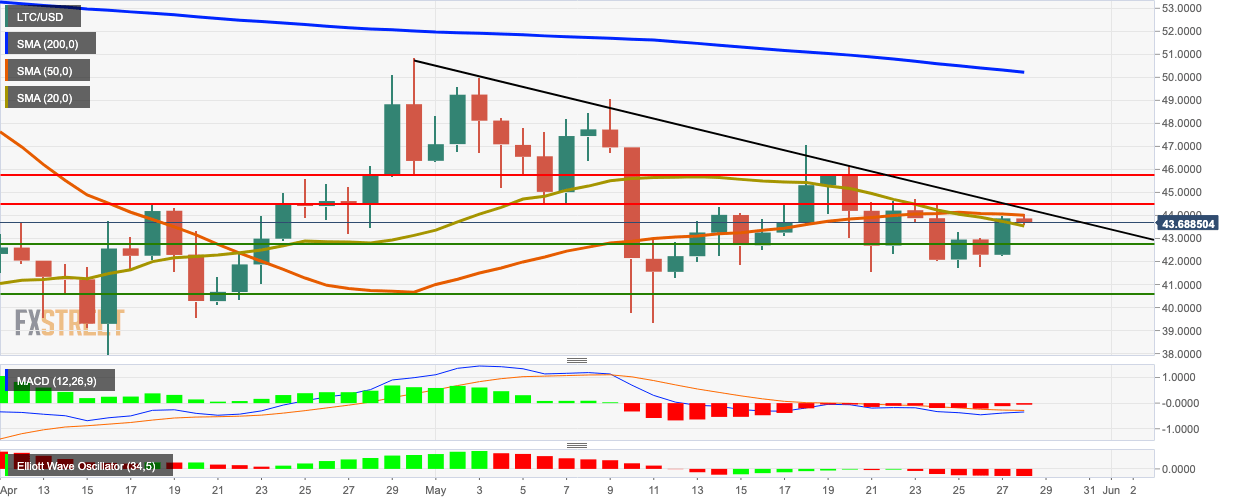
LTC/USD fell from $43.87 to $43.67 in the early hours of Thursday and is currently sandwiched between SMA 20 and SMA 50. The Elliott Oscillator has had six straight red sessions. The signal line has touched the MACD line, which indicates a reversal of bearish market momentum.
LTC/USD faces strong resistance levels at SMA 50, $44.50 and $45.80. On the downside, healthy support levels lie at SMA 20, $42.75 and $40.63.
Key levels
