- LTC/USD has stayed below $90.00 handle during Asian hours.
- The strong support is created by $86.30 level.
Litecoin (LTC) attempted a recovery above $90.00 handle and touched $91.33 during late trading hours on Monday. However, the upside proved to be unsustainable as the coin retreated to $88.90 by the time of writing. The short-term downside trend is gaining traction as Litecoin is vulnerable to bearish sentiments of the broader market.
The fourth-largest digital asset with the current market capitalization of $5.6 billion has lost about 1.5% both on a day-on-day basis and since the beginning of the day.
Litecoin’s technical picture
On the intraday charts, LTC/USD is initially supported by $88.50 with the lower line of 1-hour Bollinger Band located on approach. Once this barrier is taken, the sell-off may continue towards $86.30 and $86.00. This area is strengthened by the lower line of 4-hour Bollinger Band. The next support comes at the recent low of $84.41, while 50.0% Fibo retracement (for the significant upside move from $22.88 low) is also located on the approach to that handle. The ultimate support is created by the lower line of 1-day Bollinger Band (currently at $81.80).
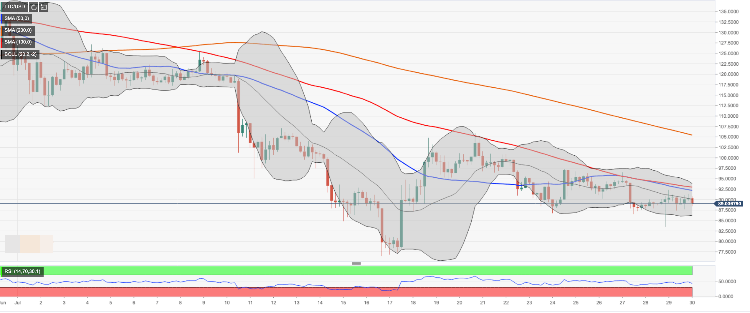
On the upside, we will need to see a sustainable move above psychological $90.00 to mitigate an immediate downside pressure. The next resistance awaits at $92.00 strengthened by SMA50 (Simple Moving Average) on 4-hour chart. It is followed by $93.00 (SMA100 4-hour) and $93.80 (the upper line of 4-hour Bollinger Band.
LTC/USD, 4-hour chart