- LTC/USD has jumped above the 20-day Bollinger Band.
- The RSI indicator is trending around 77.15 inside the overbought zone.
LTC/USD daily chart
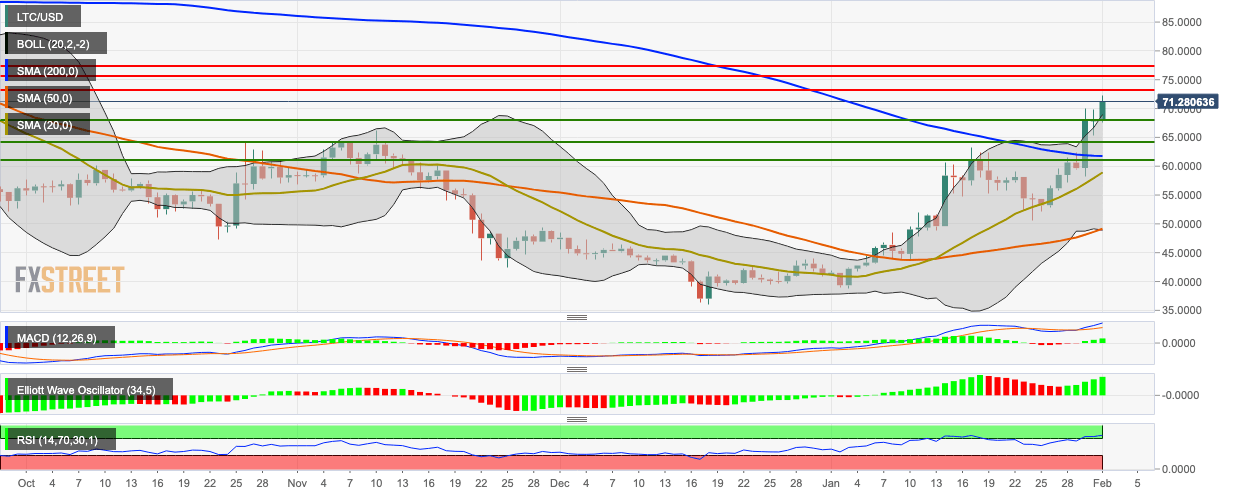
LTC/USD has managed to string together three consecutive bullish days, during which it spiked from $51.70 to $71.46. During this period, the price jumped above the 20-day Bollinger Band and the RSI went up to 77.15. Both these indicators show that LTC/USD is presently overpriced and may soon face bearish correction.
The MACD shows increasing bullish momentum, while the Elliott Oscillator has had five straight green sessions. The SMA 20 is on course to cross above the SMA 200 to chart the golden cross pattern. All these suggest that while a short-term bearish correction may be round the corner, the overall market sentiment remains bullish.
