- Litecoin price staged a recovery yesterday using support at $76.00, broke the resistance at $78.00 before spiking above $80.00.
- There is an uptrend in progress at the time of press using $81.00 and 50% Fibo as support.
Litecoin price is trading slightly lower than the opening price on Tuesday. The charts show a 1.5% drop on the day, but the trend is slowly gaining steam. LTC/USD formed a double-top pattern approximately at $84.00 as indicated on the chart. As expected lower corrections followed but the declines have met a support at $81.00.
Litecoin price staged a recovery yesterday using support at $76.00, it broke the resistance at $78.00 before spiking above $80.00. Looking at the chart, you can see that Litecoin price struggling to make higher movements above $80.00. Significantly, it traded above the resistance at $82.00 and even moved further up above $84, tested $85.00 but lost momentum before clearing the resistance.
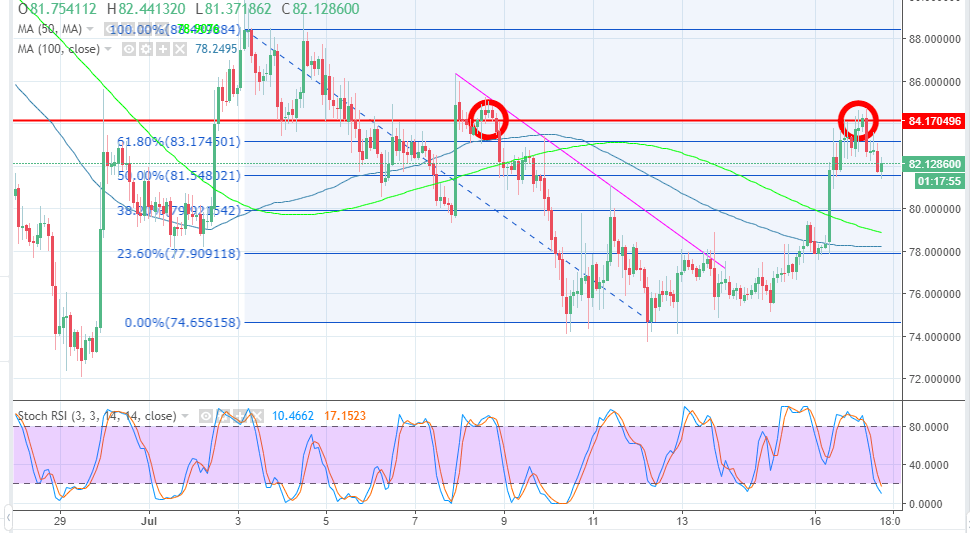
In the wake of the double-top pattern, LTC/USD found balance above $81.00 which also coincided with the 50% Fib retracement level with the last high at $88.43 and a low of $74.65. There is an uptrend in progress at the moment using $81.00 and 50% Fibo as support. To confirm the strength of the bullish trend, Litecoin price must make it above the 61.8% Fibonacci level, while a support above $83.00 will be instrumental to retesting and breaking above the key level at $85.00. It is now clear that the buyers have reclaimed $80.0, similarly, if the price can remain above this level, then we could see LTC/USD make a path towards $90.00.
LTC/USD 1-hour chart