- Litecoin has been sidelined with bearish bias recently.
- A critical resistance for LTC/USD is located at $140.00.
LTC/USD topped at $144.16 on June 12 and has been trading in a range with a bearish bias ever since. The 5th largest asset with the current market capitalization of $8.3 billion has lost of 2% of its value in recent 24 hours and about 1.5% since the beginning of Tuesday, to trade at $132.90 by the time of writing. However, Litecoin is still in a green zone on a weekly basis.
Litecoin’s technical picture
On a daily chart, LTC/USD has been sliding for the third day in succession. The downside correction may be limited by the psychological $130.00. This barrier is followed by $121.00 (the upper boundary of the previous consolidation channel with 4-hour SMA100 – Simple Moving Average – located on approach). Once it is cleared, the sell-off is likely to gain traction with the next focus on $120.00. A sustainable move below this handle will open up the way towards $110.00 handle (23.6% Fibo retracement for a significant downside move from December 2017 high and SMA200, 4-hour).
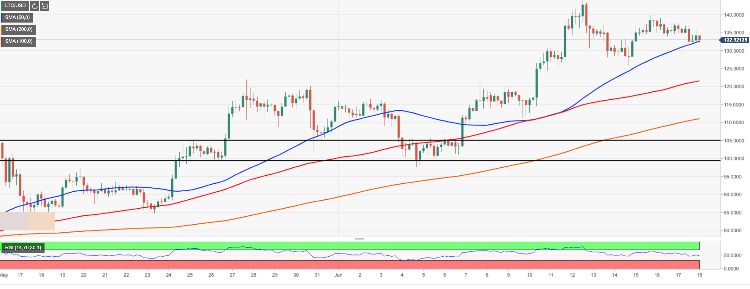
On the upside, a recovery above the initial resistance above $134.00 will allow for an extended bullish movement with the next aim at $135.40 strengthened by SMA50, 1-hour. The next upside target comes at a psychological $140.00 (June 15 high). A sustainable move above this handle will open up the way towards the recent high at $144.16.
LTC/USD, 1-hour chart