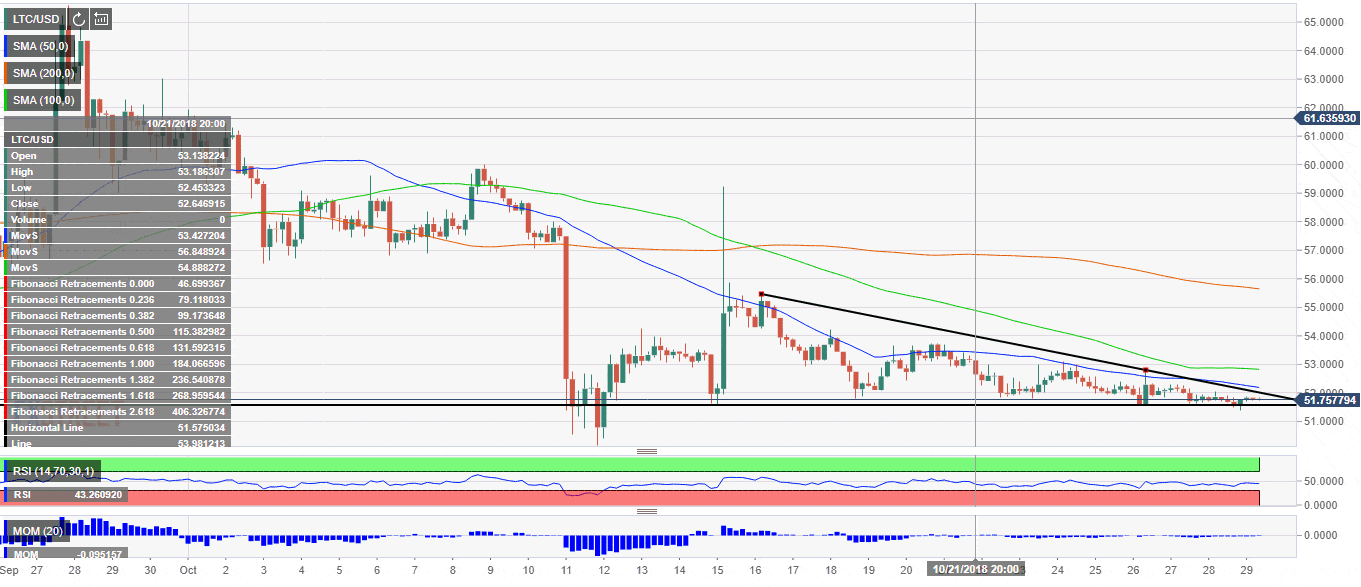
- LTC/USD is moving within a triangle pattern.
- Recovery above $52.18 will mitigate bearish pressure.
Litecoin is changing hands at $51.74, down 0.33% in recent 24 hours and unchanged since the beginning of Monday. The market value of the 7th largest coin is registered at $3B, while the average daily trading volumes reached $302M. The coin is moving within a triangle pattern, clearly visible on the 4-hour chart. This technical setup implies that the breakthrough is imminent.
Litecoin’s technical picture
On the charts, LTC/USD is squeezed in an ever-narrowing range with short-term risks seem to be tilted to the downside as the coin stays below all short-term SMAs and capped by the sloping trendline from October 16 high.
The critical horizontal support line lies with $51.50. Once it is broken, the sell-off may gain traction with the next focus on $50.17 (October 11 low) and psychological $50.00.
Meanwhile, Litecoi bulls have to push the price above $52.18 (above-said trendline and SMA50, 4-hour), to mitigate the bearish pressure. The next resistance is seen at $52.85 (SMA100, 4-hour) and $53.00.
While the Relative Strength Index (RSI) is turning down, we may need a strong trigger more trading activity amid listless cryptocurrency market.
LTC/USD, 4-hour chart

