- LTC/USD formed a high at $81.92 before reverting to the current value of $80.92.
- Litecoin is poised to move sideways in the short-term even as technical stay positive.
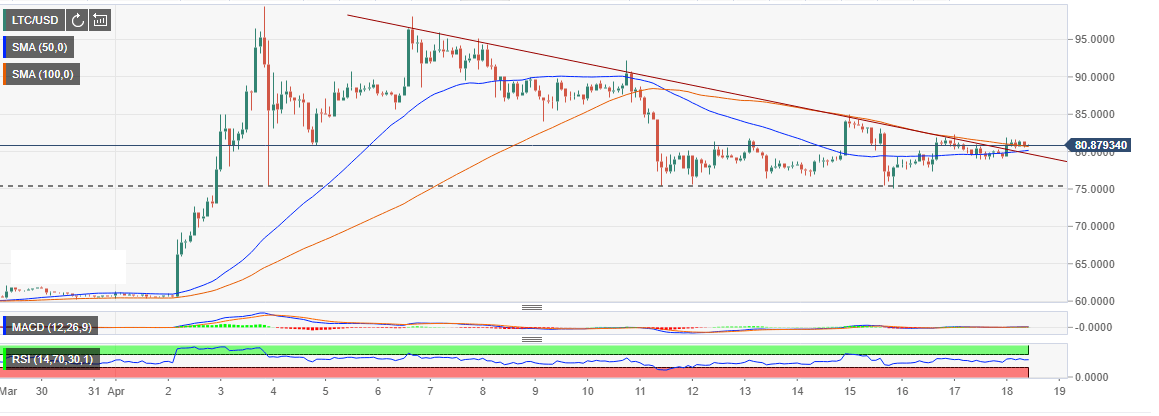
LTC/USD has been trading sideways above key support established at $75.00 following the drop on April 11. The upside was limited under the descending trendline until the breakout that occurred today, Thursday 18.
Further upside movement stepped above the 50 simple moving average (SMA) 2-hour chart opened the door for a correction above resistance at $80.00. The buyers increased their grip which led to a spike above the 100 SMA 2-hour. LTC/USD formed a high at $81.92 before reverting to the current value of $80.92.
According to the relative strength index (RSI) which is horizontal at 56.25, the price is poised to move sideways in the short-term. The indicator has been averaging around 50.00 to show that Litecoin technical structure is still positive although the upside has been capped below $85.00. Another indicator for sideways trading is the MACD which currently hugs the mean line.
The former resistance level at $80.00 will function as support. The 100 SMA and the 50 SMA in the 2-hour range will also work to prevent declines below $80.00. However, the key support is observed at $75.00.
LTC/USD 1-hour chart