- Litecoin’s network activity is significantly high, despite low prices.
- The divergence could be foreshadowing a move up by LTC in the cryptocurrency markets.
- Litecoin’s MimbleWimble protocol is on track for a testnet launch this month.
Despite the recent drop in prices, Litecoin’s (LTC) network activity has continued to be significantly high. Data by Santiment shows that Litecoin has witnessed a three-month high in address activity divergence when compared to its current price level.
As per Metcalfe’s law, the price of a coin or a token is generally dependent on the network activity. In Litecoin’s case, a divergence between daily active addresses and price could foreshadow LTC’s possible push in the cryptocurrency markets in the near future.
In a recent tweet, David Schwartz, Litecoin Foundation’s Project Director, used some stats to explain that Litecoin’s fundamentals are currently very strong.
Furthermore, in his monthly MimbleWimble update, David Burkett noted that everything is on schedule for a testnet launch this month.
Everything is on track for a testnet release at the end of this month. I’m still figuring out a few final details, but I’ll share more information later this month about what the testnet will look like and how everyone can get involved.
LTC/USD daily chart
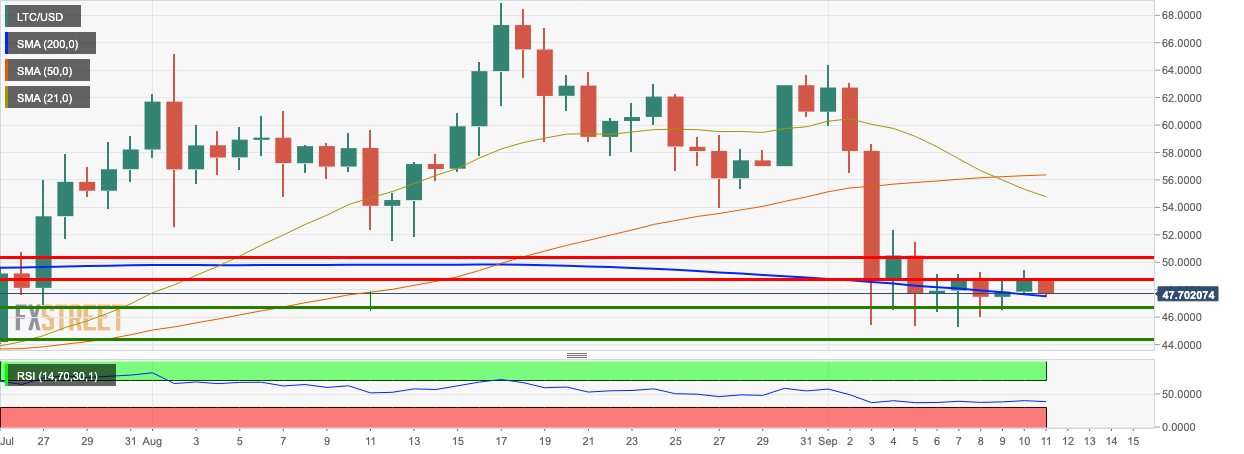
LTC/USD bulls failed at the $48.70 resistance line. The price has since dropped to $47.55 in the early hours of Friday and is presently sitting on top of the SMA 200 curve. The relative strength index is hovering horizontally around 39.39 and hasn’t dropped to the oversold territory, yet. As such, more price drop could be expected. However, can we expect any wild price swings? Not quite, as per the IOMAP.
LTC IOMAP
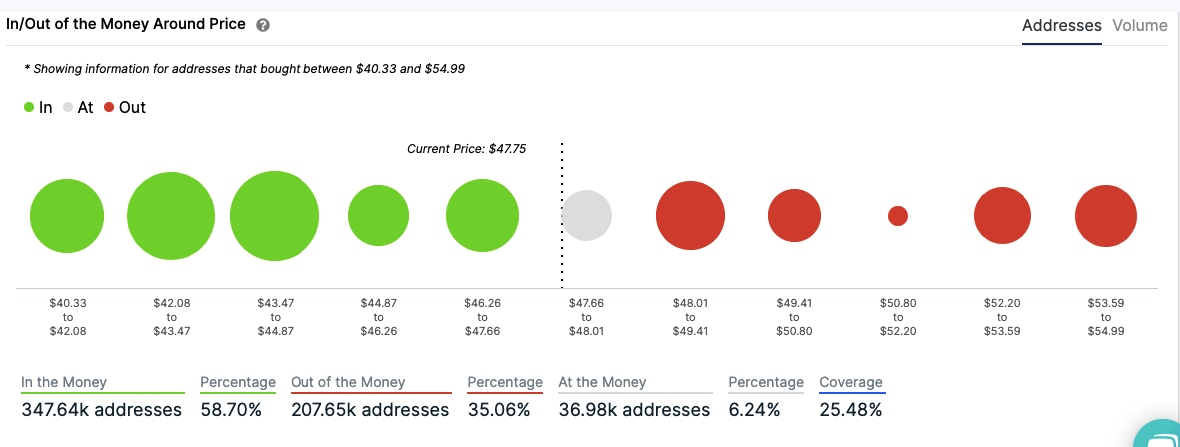
LTC is sandwiched between strong healthy and support levels. The price can only hover between $46.26-$48.
LTC/USD hourly chart
-637353955866372657.png)
LTC/USD hourly chart failed at the $48.75 resistance line and has since charted five straight bearish sessions. In the process, the hourly price chart is trending in a downward channel formation. The MACD shows increasing bearish momentum, so overall sentiment in the hourly chart remains bearish.
Key levels
