- Litecoin loses 1.5% in 24 hours to trade at areas below $170.
- LTC price prediction is largely bearish as validated by technical indicators.
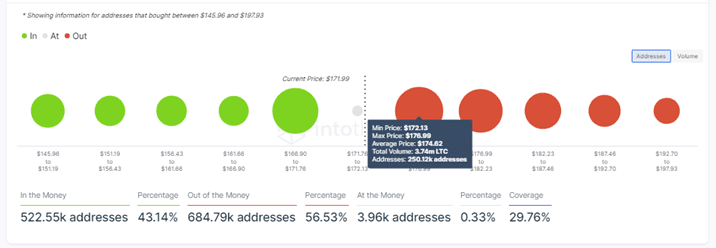
- IntoTheBlock’s IOMAP model shows that Litecoin faces massive resistance upwards.
Litecoin price has lost roughly 15% of its value from the August 23 high at $191.85. The retreat has been consistent over the last 7 days. LTC flipped various support levels to barriers, including the $185 major support level, 100 Simple Moving Average (SMA) at $177, 50 SMA at $175.50 and the 20 SMA at $173.5. The downtrend tanked Litecoin below the $170 mark late yesterday. At the time of writing, Litecoin trades at $170.70 as the bears remain focused to maintain the price below $170.
Litecoin Price Faces Significant Hurdles Upwards
Following the sharp downtrend from areas above $191, LTC/USD price slid below the rising July trendline on August 24. This warranted a breather as bulls sought support at the $172.35 level. However, this allowed the bears to regroup, and re-focus on areas around the August 19 low at $162. This was almost achieved in today’s intraday low at $165.10, embraced by the 200 period SMA.
Note that if LTC closes the session below the $170 mark, it will drop towards the immediate support level at $167.52. If bears are strong enough to defeat this support, the next key level to watch would be the support at $165.10 coinciding with the 200-day SMA or the $160 psychological level.
LTC/USD Four-Hour Chart
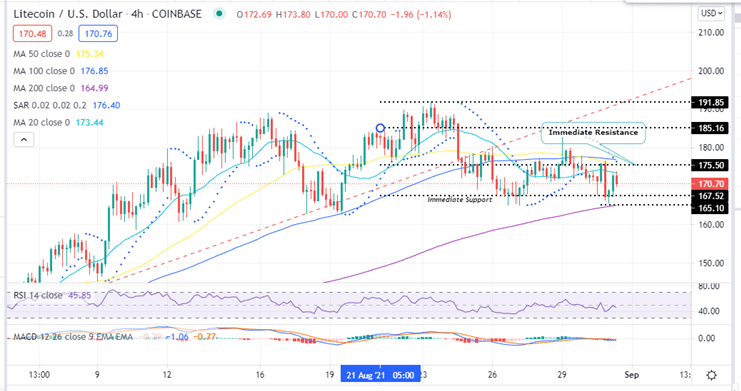
This short-term Litecoin price prediction is bearish as accentuated by the down-sloping SMAs and the negative Parabolic SAR. Note that the parabolic SAR reversed from positive to negative yesterday and flipped above the price. As long as the parabolic SAR remains above the price, the bearish momentum will continue. Moreover, the Moving Average Convergence Divergence (MACD) indicator favours LTC’s bearish momentum. Its movement below the neutral line in the negative zone shows that sellers are in control of Litecoin.
Also not that the MACD sent a bearish crypto signal yesterday on the four-hour chart. This occurred when the MACD line (blue) crossed below the signal line (orange). As long as the MACD line continues to move below the signal line, the bearish leg will be extended further.
This bearish bias is also supported by metrics from IntoTheBlock whose In/Out of the Money Around Price (IOMAP) model indicates that Litecoin is facing significant resistance upwards. Its immediate resistance at $175.50 is within the $172 and $177 price range where approximately 250,120 addresses previously bought 3.74 million LTC.
Litecoin IOMAP Chart
On the flip side, if Litecoin rises to close the session above the 20 SMA at $173, it would trigger immense buy orders amid intensifying gains toward $175.50 resistance level. Closing the day above this level could bolster the bulls to take LTC higher to re-test the August 23 highs around $191.85.
To achieve this, LTC must rise above the July rising trendline to ensure a decisive bullish breakout.
Where to Buy Litecoin
The top exchanges for trading in LTC currently are: eToro, FTX, Binance and Coinbase. You can find others listed on our crypto exchanges page.
Looking to buy or trade Litecoin now? Invest at eToro!
Capital at risk
