- Litecoin builds upon the confluence support levels above $70 to sustain gains to $80.
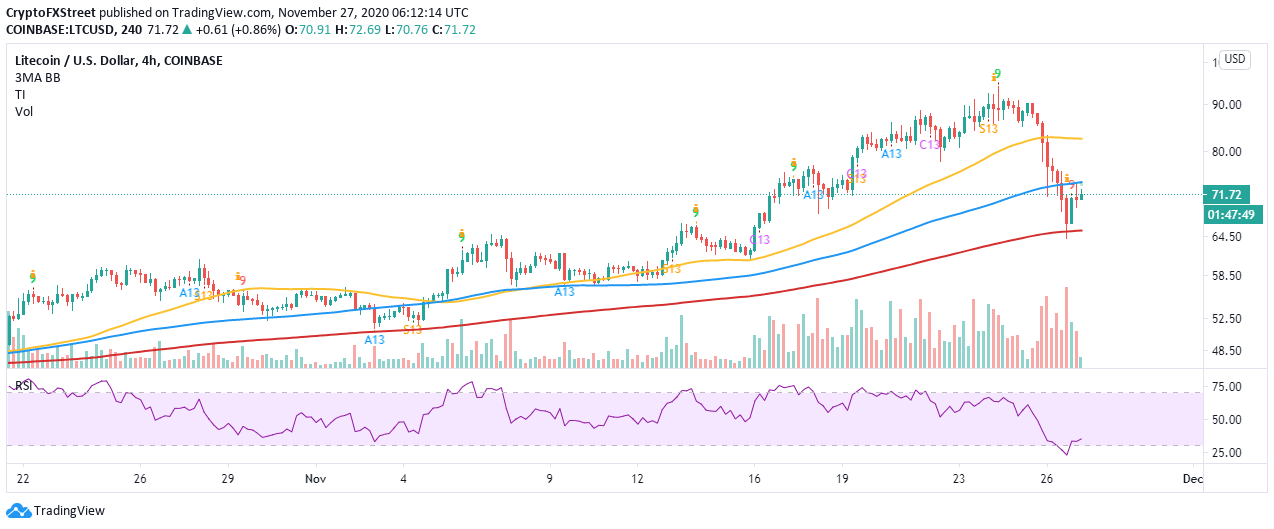
- LTC/USD has to close the day above the 50 SMA on the 4-hour chart to confirm the expected breakout.
Litecoin embraced support at $65 following a sharp drop on Thursday. A higher short term anchor has been established at $70. LTC/USD is trading at $72 amid a consistent push for further recovery from the bulls.
Litecoin bulls fix their eyes on $80 as recovery looms
LTC is trading above the 50 Simple Moving Average, which gives credence to the bullish narrative. Note that Litecoin has not exchanged hands beneath this crucial level since mid-October.
The 50 SMA is still increasing the gap above the 100 SMA and the 200 SMA, suggesting that buyers have the upper hand. Resistance is anticipated at $80 and is likely to delay the uptrend targeting $90 and $100, respectively.
LTC/USD daily chart
The TD Sequential indicator has presented a buy signal in the form of a red nine candlestick on LTC’s 4-hour chart. The bullish formation approximates that a surge in demand for Litecoin could see it spike for one to four daily candlesticks. Note that if buying pressure consistently builds, LTC/USD might begin a new uptrend toward $100.
LTC/USD 4-hour chart
The same 4-hour chart shows that if Litecoin closed the day above the 50 SMA, a breakout might come into the picture for gains eyeing $80 and beyond. Similarly, the Relative Strength Index has recovered from the oversold, thus reinforcing the bullish outlook.
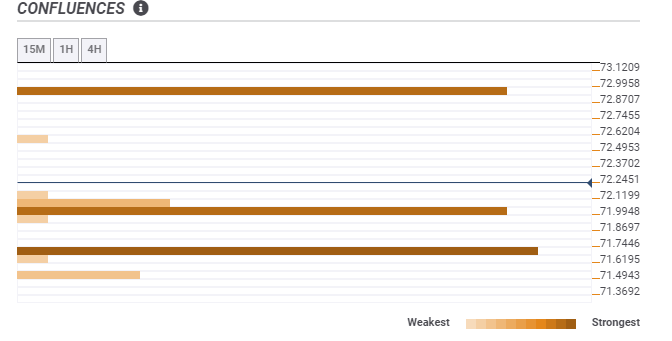
According to the confluence detector, Litecoin is sitting on areas with immense support. The initial anchor is seen at $71.9, as highlighted by the One-day Bollinger Band middle boundary, the previous low 15-minutes, and the previous high one-hour.
The second robust support lies at $71.7 and is home to the Fibonacci 38.2% one-day and the 15-minutes Bollinger Band middle boundary. On the upside, trading above the confluence resistance at $72.9 might trigger a rally to $80.
LTC/USD confluence chart
It is worth mentioning that if the price closed the day under the 50 SMA on the 4-hour chart, Litecoin might be forced to abandon the bullish outlook. On the other hand, breaking below the confluence support could trigger massive declines, perhaps strong enough to overshoot the next critical support at the 200 SMA in the same 4-hour timeframe.
%20(11)-637420561403639065.png)


