- Litecoin price is currently bounded inside a symmetrical triangle pattern on the 1-hour chart.
- The digital asset looks poised for a breakout that would push it by 16%.
Litecoin has been under consolidation for the past two days and has formed a symmetrical triangle pattern on the 1-hour chart. The digital asset looks primed for a massive 16% breakout towards $166.
Litecoin price needs to crack $142 to see $166
LTC is currently trading just below a critical resistance level at $142 which would open the doors for a 16% breakout towards $166. The digital asset formed a symmetrical triangle on the 1-hour chart which seems to be on the verge of cracking.
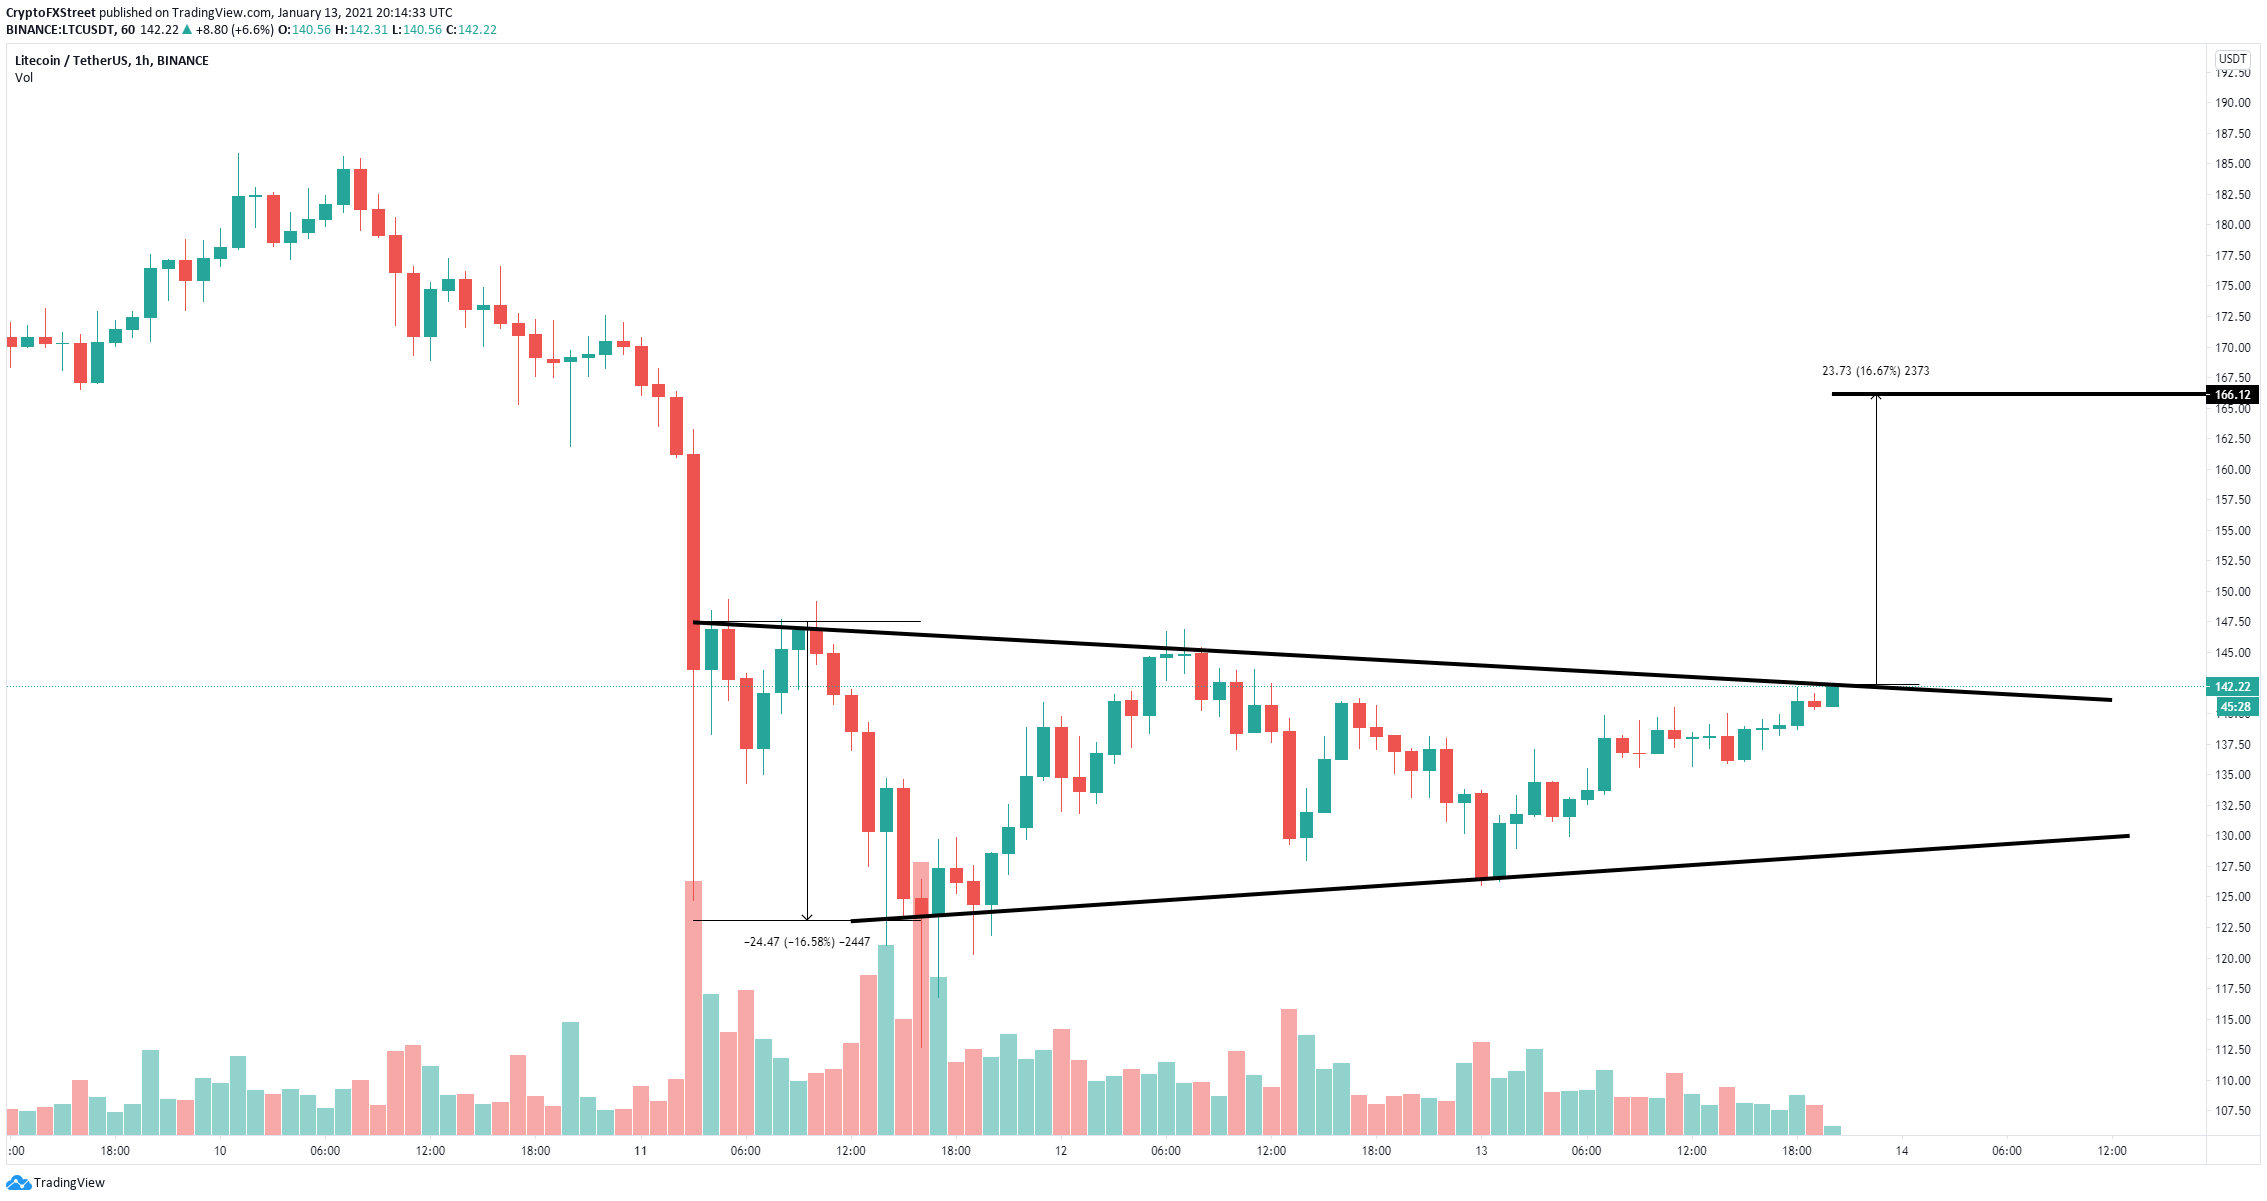
LTC/USD 1-hour chart
The technical confluences also show that $142 is a strong resistance level indicating that the 4-hour middle Bollinger band, the 15-minutes upper Bollinger band and the previous 15-minutes high converge on that point. Additionally, there is also a strong resistance level at $144 where the daily middle Bollinger band currently stands.
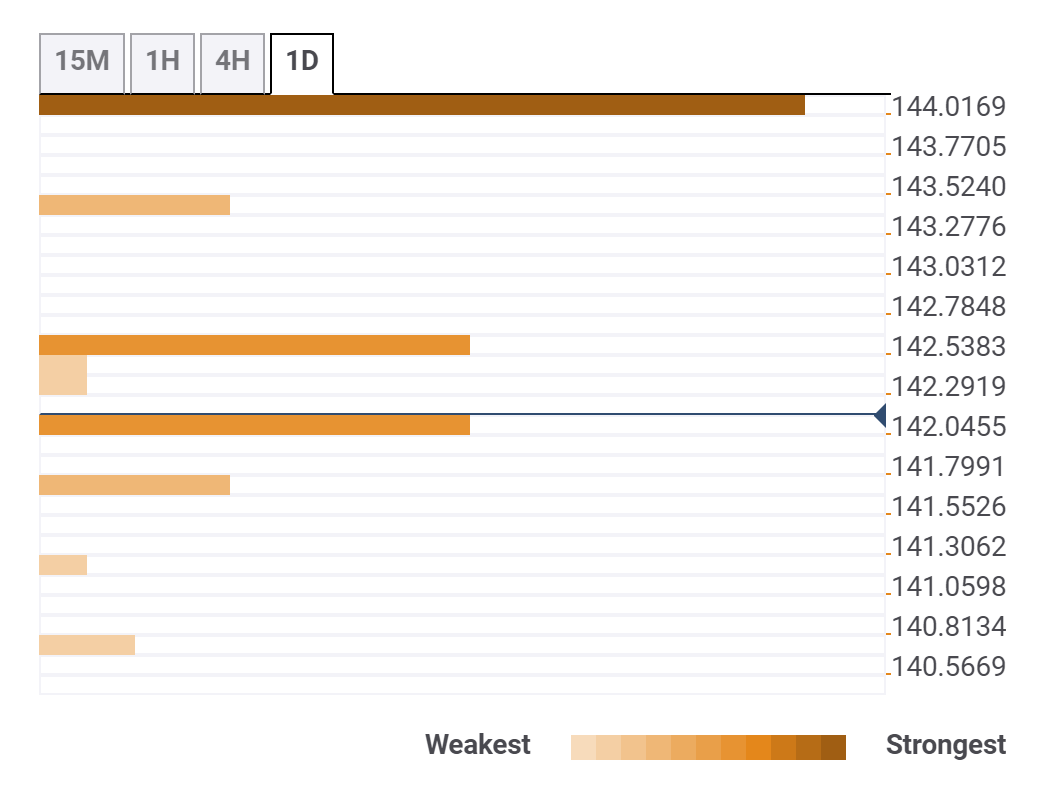
LTC Confluences
On the way down the $142 level also serves as support as it is the previous 4-hour high. At $141.7, we find the previous hourly high. A rejection from $142 and a loss of these two levels would be bearish and could potentially drop Litecoin price down to $130.
