- Litecoin could spiral to the primary support at $65 if the short-term anchor at the 100 SMA is lost.
- The confluence detector shows that Litecoin’s upside is immensely barricaded due to the seller congestion at $83.3.
Litecoin is trading between a crucial resistance and support. The 50 Simple Moving Average limits the coin’s upside on the 4-hour chart. On the downside, the 100 SMA is attempting to offer support. A breakdown is likely to come into the picture, especially if immediate support caves.
Litecoin downtrend likely to resume towards $65
LTC/USD is trading at $82.7 at the time of writing. Losses are expected to engulf the crypto mostly if the price closes the day under the 100 SMA. Buyer congestion at $80 and $75 will absorb some of the selling pressure, but the primary support holds the ground at $65.
The bearish outlook seems to have been validated by the Relative Strength Index. The RSI continues to form a bearish divergence from the price, signaling that buying volume is reducing while sellers seek to regain control over the price.
%20(15)-637430124778888456.png)
LTC/USD 4-hour chart
The confluence detector tool reveals that room for growth from the current price level is limited. Immense seller congestion at $83.3 is likely to keep delaying recovery. The zone is home to the 5 SMA 4-hour, the 1-hour previous high and 10 SMA 4-hour.
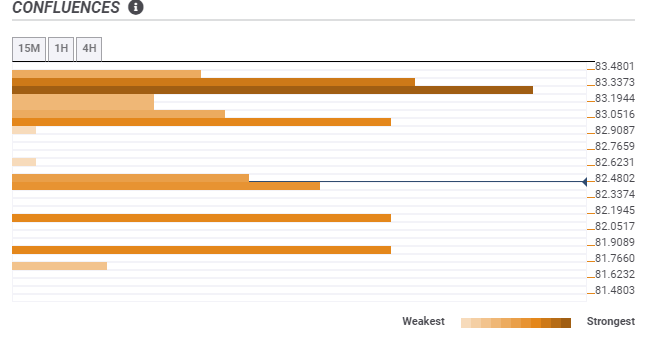
LTC/USD confluence levels
On the downside, the immediate support at $82.4 does not seem strong enough to hold Litecoin for long. Converging here are the 15-minutes previous low, one-hour previous low, and the 4-hour previous low. Slightly more vital support is observed at $81.9 and $82.2. The one-day Bollinger Band middle boundary and the one-day previous low meet here.
On the other hand, the bearish outlook will be sabotaged if LTC climbed above the resistance at $83.3. Moreover, price action above $85 would call for more buy orders, which might create enough volume for gains toward $100.
