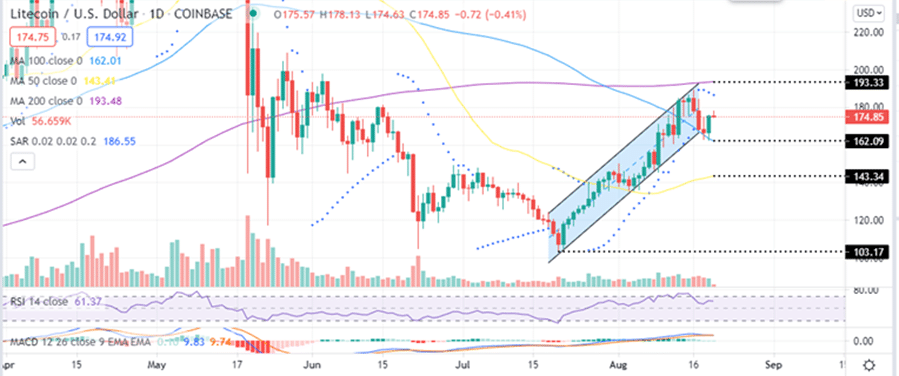
- Litecoin price bounces off the 100 SMA support to face resistance at $179.
- The Parabolic SAR flipped negative indicating the possibility of an extended bearish leg.
- Investors may look to buy to buy LTC on top exchanges like eToro.
Litecoin is trading in the red for the fourth day this week as bears focus on undoing the 80% gains witnessed from the July 21 low at $103 to the August 16 high at $189. This bearish outlook appeared after the Litecoin price was rejected by the $193 major resistance level, embraced by the upper boundary of the rising channel and the 200-day Simple Moving Average (SMA). The seller congestion at this area remains intact, challenging recovery attempts that are eyeing a breakout above the upper boundary of the ascending parallel channel.
Meanwhile, the LTC/USD is exchanging hands at $174.85 after bouncing off the support provided by the 100-day SMA at $162.
Litecoin Price Faces Significant Resistance Upwards
The short-term technical picture appears to have flipped bearish as LTC dropped from the Monday intraweek high at $189. According to the daily chart, the Parabolic SAR indicator flipped from positive to negative to negative on Monday kickstarting the correction.
The bulls must keep the price above $180, a move that could ensure market stability and increase the chances of the Litecoin price turning bullish. In the meantime, remaining within the rising channel price range will favours the bulls, but breaking above the $180 psychological level will increase the odds of overcoming the resistance at the 200-day SMA.
Trading above this level may trigger more buy orders as speculation mounts for gains to $220. Investor interest is expected to shoot up, especially after fundamentals kick in.
This bullish outlook is validated by the position of the Moving Average Convergence Divergence (MACD) indicator above the signal line in the positive region. Moreover, the movement of the RSI above in the buy zone currently at $62.83 accentuates this bullish narrative.
- If you wish to take the plunge, check out our detailed guide on how to buy cryptocurrency.
LTC/USD Daily Chart
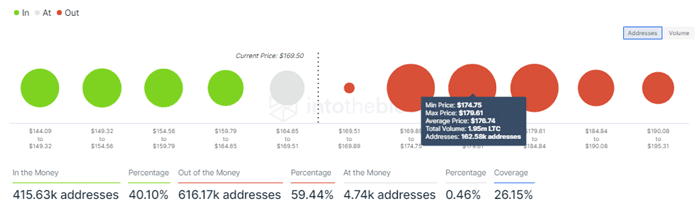
Things are, however, not rosy for LTC bulls as the immediate resistance at around the $179 significant resistance. According to IntoTheBlock’s IOMAP on-chain metrics, this areas is within the$174 and $179 investor cluster where roughly 162,000 addresses previously bought approximately1.95 million LTC. These investors may wish to break even as the price rises, dampening the bullish pressure.
Litecoin IOMAP Chart
On the downside, a daily closure below this immediate support at $169 may trigger sell orders which would see Litecoin seek for support from the 100 SMA at $162 and the 50 SMA at $143 respectively.
How to Buy Litecoin
If you would like to know how to buy Litecoin, the top exchanges for trading in LTC currently are: eToro, FTX, Binance and Coinbase. You can find others listed on our crypto exchanges page.
Looking to buy or trade Litecoin now? Invest at eToro!
Capital at risk
