- LTC/USD went up from $70 to $72 in the early hours of Tuesday.
- Moving average convergence/divergence (MACD) indicator shows increasing bullish momentum.
LTC/USD continued its recovery this Tuesday as its price went up from $70 to $72. Over the last four days, the price has gone up from $65 to $72. During the same period, the price had crossed over the downward trending line. LTC/USD is currently trending in an upward channel formation. The price is negotiating with the resistance at $75.
LTC/USD daily chart
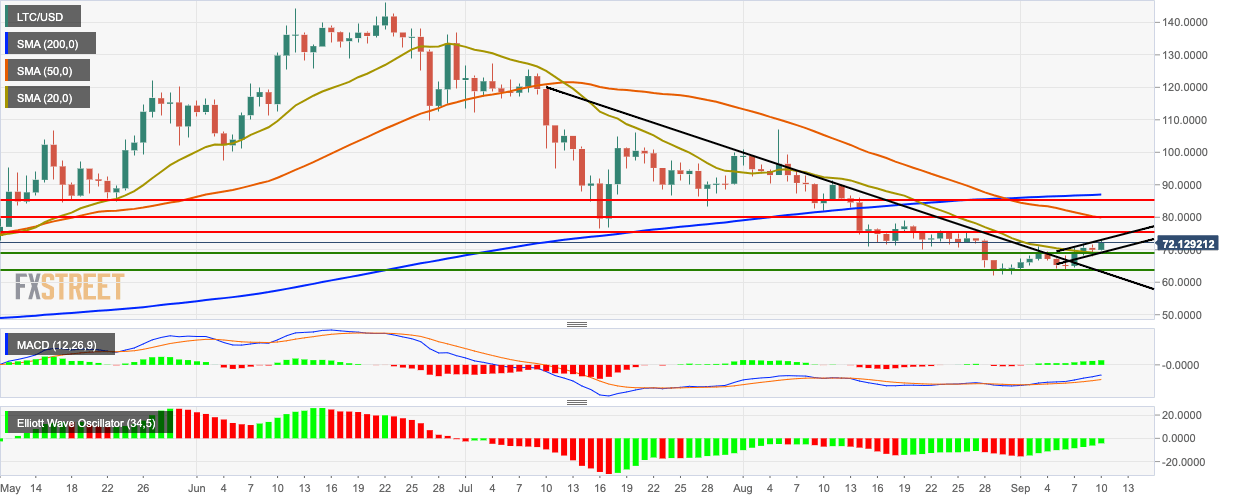
LTC/USD is trending above the 20-day simple moving average (SMA 20) curve, while it’s below the SMA 50 and SMA 200 curves. The moving average convergence/divergence (MACD) indicator shows increasing bullish momentum. The Elliott oscillator has had nine straight bullish sessions.
