- LTC/USD went up from $75 to $76 as markets opened this Wednesday.
- LTC/USD had earlier gone up from $68.17 to $75 this Tuesday.
LTC/USD bulls had a field day this Tuesday as they took the price of the asset up from $68.17 to $75, breaking past the $70 and $75 barrier in the process. As per the daily confluence detector, LTC/USD bulls can target the $80 before facing any real resistance. This Tuesday was the first bullish day after four consecutive bearish days.
LTC/USD Daily Confluence Detector
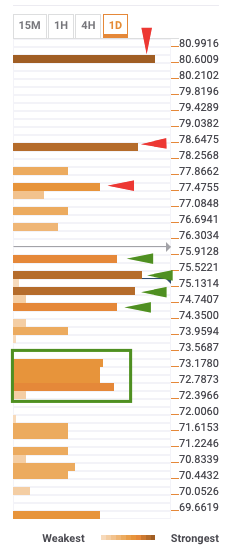
LTC/USD has resistance levels at $77.75, $78.50, and $80.75. The confluences at those levels are:
- $77.75: Weekly 61.8% Fibonacci retracement level.
- $78.50: No confluence detected.
- $80.75: Weekly pivot point resistance 1 and daily pivot point resistance 2.
The support levels are at $75.75, $75.50, $75, $74.50, $72.50-$73.25. The confluences at those levels are:
- $75.75: Hourly previous high, 4-hour previous high, daily previous high, and 15-min Bollinger band upper curve.
- $75.50: 15-min previous high and monthly 61.8% Fibonacci retracement level.
- $75: 15-min previous low and 4-hour Bollinger band upper curve.
- $74.50: Weekly 38.2% Fibonacci retracement level, 15-min Bollinger band middle curve, and 5-day simple moving average (SMA 5)
- $72.50-$73.25: SMA 10, 15-min Bollinger band lower curve, 4-hour previous low, SMA 5, SMA 50, daily 382% Fibonacci retracement level, weekly 23.6% Fibonacci retracement level, and SMA 200.
