- LTC/USD has gone down from $82.75 to $67 over the last ten days.
- LTC/USD lacks healthy support levels until $63.
LTC/USD went down from $69 to $67 this Monday. This is the third consecutive day that LTC/USD has experienced a bearish session. LTC/USD has also had nine bearish days among the last ten. In the previous ten days, LTC/USD has gone down from $82.75 to $67, losing a whopping 19% of its value. The daily confluence detector shows that price may drop down to $63 as it lacks any sound support levels.
LTC/USD Daily Support
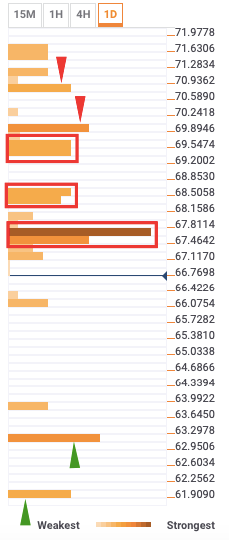
LTC/USD daily support shows a lack of any significant support levels until $63. The support levels lie at $63 and $62. The confluences at those levels are:
- $63: Previous month high.
- $62: Weekly pivot point support 2.
LTC/USD faces several stacks of resistance at $67.25 – $67.75, $68.25 – $68.75, $70, and $70.75. The confluences at those levels are:
- $67.25 – $67.75: SMA 10, weekly pivot point support 1, 15-min Bollinger band middle curve, SMA 50, SMA 5, daily pivot point support 1, and monthly pivot point resistance 1.
- $68.25 – $68.75: Hourly Bollinger band middle curve, daily Bollinger band lower curve, SMA 100, SMA 5, and daily previous low.
- $70: Daily 38.2% Fibonacci retracement level.
- $70.75: 4-hour Bollinger band middle curve and daily 61.8% Fibonacci retracement level.
