- Litecoin steps above $50 for the first time since November 2017 after more than doubling in value.
- A correction above $50.00 will place Litecoin back on the trajectory towards $60.00.
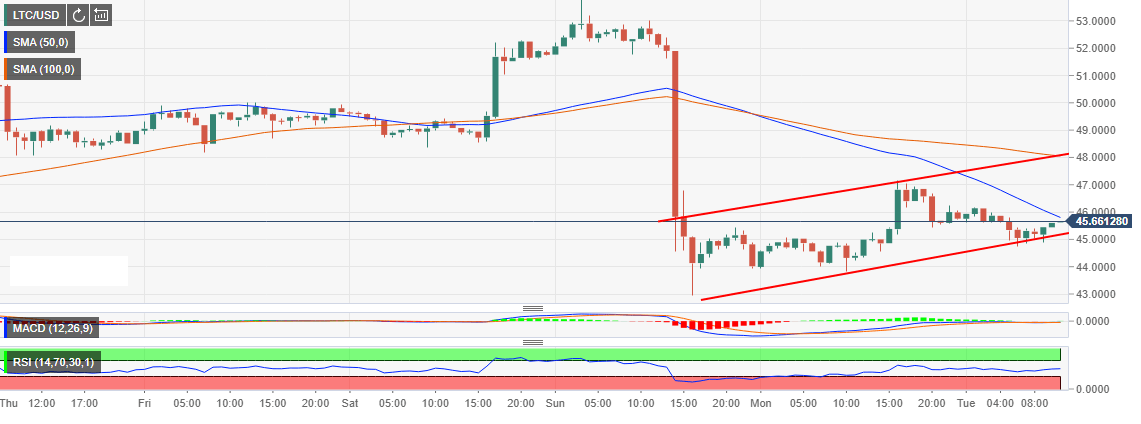
The hourly outlook of LTC/USD shows how the bears send Litecoin tumbling below $50 on Sunday last week. The move came after Litecoin had extended the bullish momentum slightly above the $53 resistance hurdle. This was the first time Litecoin has stepped above $50 level since November 2017.
From the lows in December 2017 around $22.37, Litecoin has more than doubled its price to the current $45.60 representing a 50.94% growth. The rejection from the four-month high resulted in a devastating drop show on the chart by an extended bearish candlestick. LTC/USD did not find support at $44.00 (current support) bur $43.00 came in handy preventing further breakdown.
There has been a correction from the weekly low of $43.00 forming a bullish flag pattern that is currently approaching a breakout. However, the bulls must clear the resistance at the hourly 50-day Simple Moving Average (SMA) in order to allow LTC to rise above the pattern resistance. A correction above $50.00 will place Litecoin back on the trajectory towards $60.00.
The growing bullish trend is supported by the Relative Strength Index (RSI) on the same chart which is slopping upwards steadily. The Moving Average Convergence Divergence (MACD) is almost crossing into the positive region from a lower level around -1.9584.
LTC/USD 60-minutes chart