Home Litecoin Technical Analysis: LTC/USD another rejection from descending trend line, key supporting $72 area is still vulnerable to a breach
Crypto News

Litecoin Technical Analysis: LTC/USD another rejection from descending trend line, key supporting $72 area is still vulnerable to a breach

  • Litecoin is seen up just some 1% on Tuesday, upside was capped by a strong descending trend line.  
  • LTC/USD upside consistently of late looks liable to bears selling the rallies, given the longer-term trend remaining intact.


LTC/USD 60-minute chart
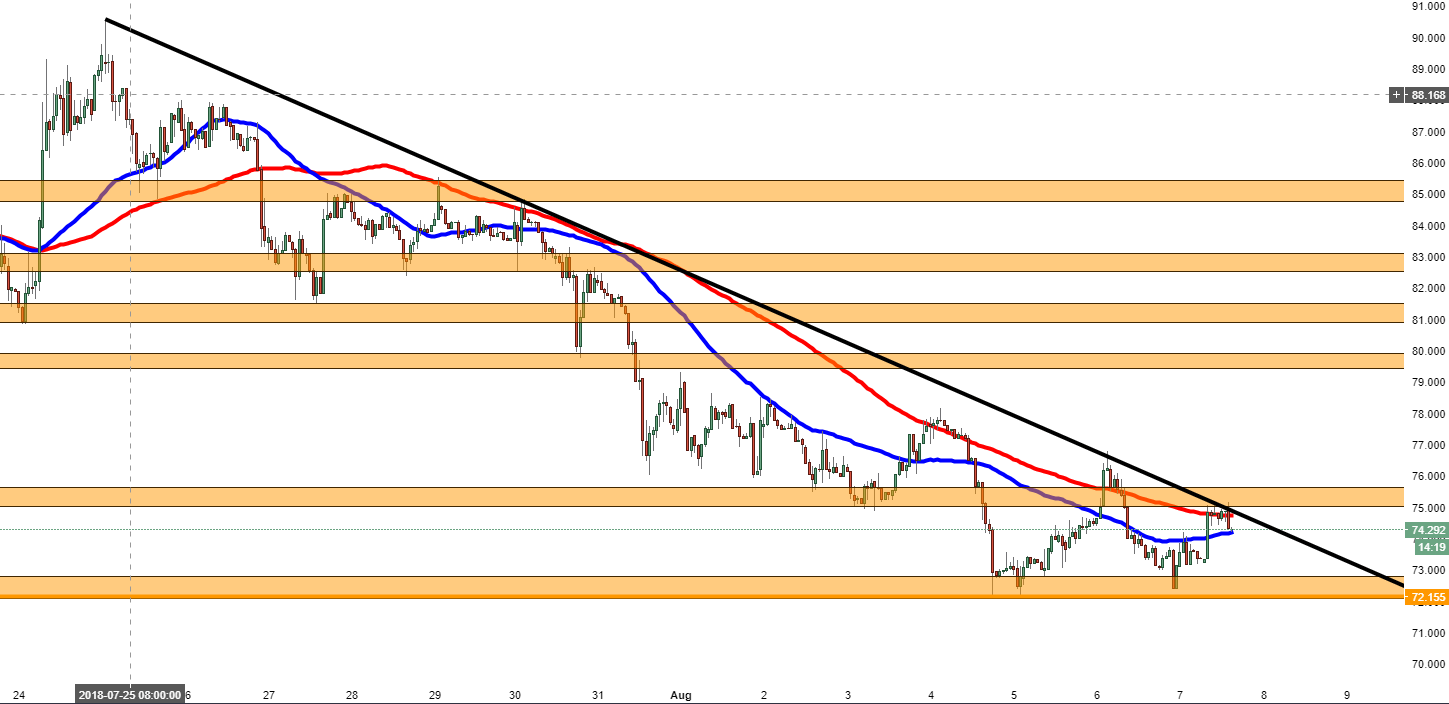


Spot rate:                    74.253

Relative change:        +0.95%

High:                          75.150

Low:                           73.160

Trend:                         Bearish  
 

Support 1:                  74.110,  50MA.

Support 2:                  72.810, entrance to demand zone.

Support 3:                  72.155,  4th and 5th August low, (9-month low).

Resistance 1:             75.100, descending trend line & supply zone.

Resistance 2:             77.055, (resistance on 60-minute chart).

Resistance 3:             78.140, 4th August high.


FX Street

FX Street

FXStreet is the leading independent portal dedicated to the Foreign Exchange (Forex) market. It was launched in 2000 and the portal has always been proud of their unyielding commitment to provide objective and unbiased information, to enable their users to take better and more confident decisions.