Home Litecoin Technical Analysis: LTC/USD bears smash through critical area of support on triangle structure
Crypto News

Litecoin Technical Analysis: LTC/USD bears smash through critical area of support on triangle structure

  • Litecoin price seen down a heavy 5% in the session on Monday, one of the notable under-performers.  
  • LTC/USD sees lower support of triangular pattern formation broken to the downside.
  • Price is forced to give up the big psychological $50 mark, with weight seen across the board.  


LTC/USD 4-hour  chart  
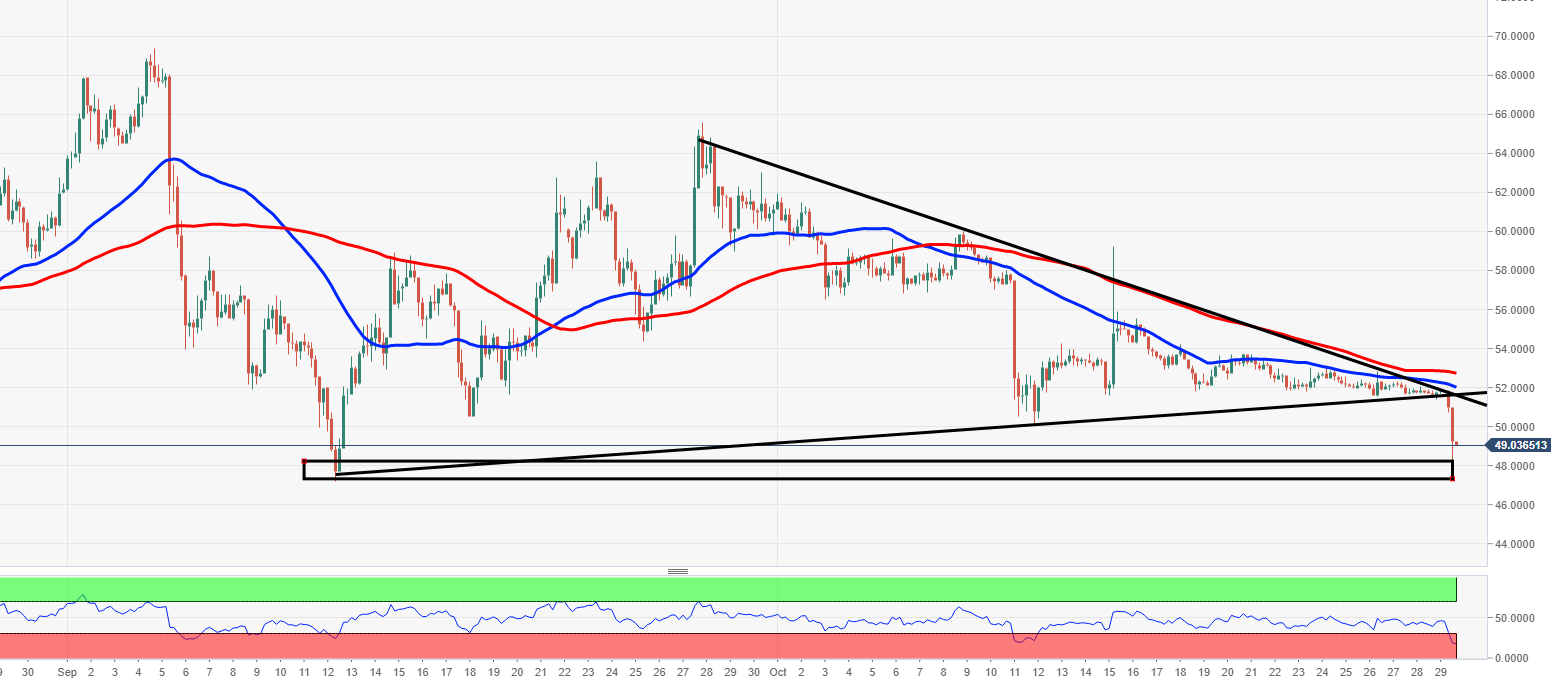


Spot rate:                   49.278

Relative change:       -4.82%

High:                          52.042

Low:                           51.368


Trend:                        Bearish


Support 1:                  47.248, 12th September low & demand area.

Support  2:                  45.700, Support on 4-hour chart.

Support  3:                  35.550, 15th September low.  

Resistance  1:             51.510, underneath broken triangular pattern.

Resistance  2:             52.080, 50MA (4-hour).

Resistance  3:             52.850, 100MA (4-hour) & resistance.  

FX Street

FX Street

FXStreet is the leading independent portal dedicated to the Foreign Exchange (Forex) market. It was launched in 2000 and the portal has always been proud of their unyielding commitment to provide objective and unbiased information, to enable their users to take better and more confident decisions.