Home Litecoin Technical Analysis: LTC/USD bloodshed prevented by demand zone, 14th & 16th June lows, price down over 1% on Monday, a failed break above $94 could be costly
Crypto News

Litecoin Technical Analysis: LTC/USD bloodshed prevented by demand zone, 14th & 16th June lows, price down over 1% on Monday, a failed break above $94 could be costly

  • Litecoin price softens again on Monday, however grabs support at the lows of 14th and 16th June.  
  • LTC/USD at risk of dropping down to $89, if it fails to break above and clear resistance at $94 level.
  • A clearance of the above-mentioned resistance can allow Litecoin a run up to $96-97, the barrier ahead of $100.


LTC/USD 60-minute chart
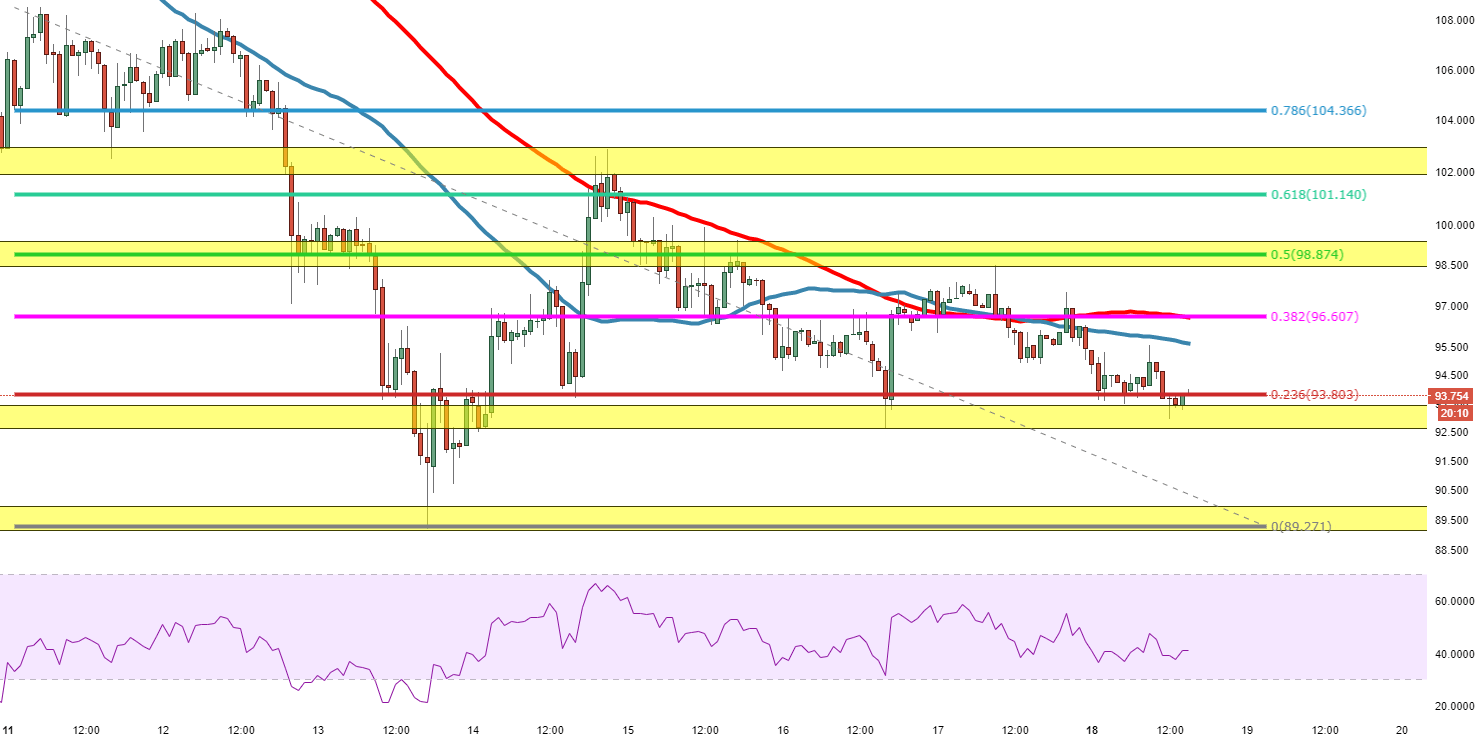
Spot rate:                                     93.76

Relative change:               -1.20%

High:                                                     95.53

Low:                                                       92.94


Trend:                                                   Bearish


Support 1:                                  92.60, 14th & 16th June lows.

Support 2:                                    90.00, opening of demand zone.

Support 3:                                    84.50, 7th December 2017 low.

Resistance 1:                           95.60, 50MA.

Resistance 2:                           96.50, 38.2% Fibonacci.

Resistance 3:                           98.70, supply zone


FX Street

FX Street

FXStreet is the leading independent portal dedicated to the Foreign Exchange (Forex) market. It was launched in 2000 and the portal has always been proud of their unyielding commitment to provide objective and unbiased information, to enable their users to take better and more confident decisions.