- Litecoin price was holding modest gains of some 0.7% into the second half of Wednesday’s session.
- LTC/USD price action has formed a bearish pennant pattern, subject to an extended move south.
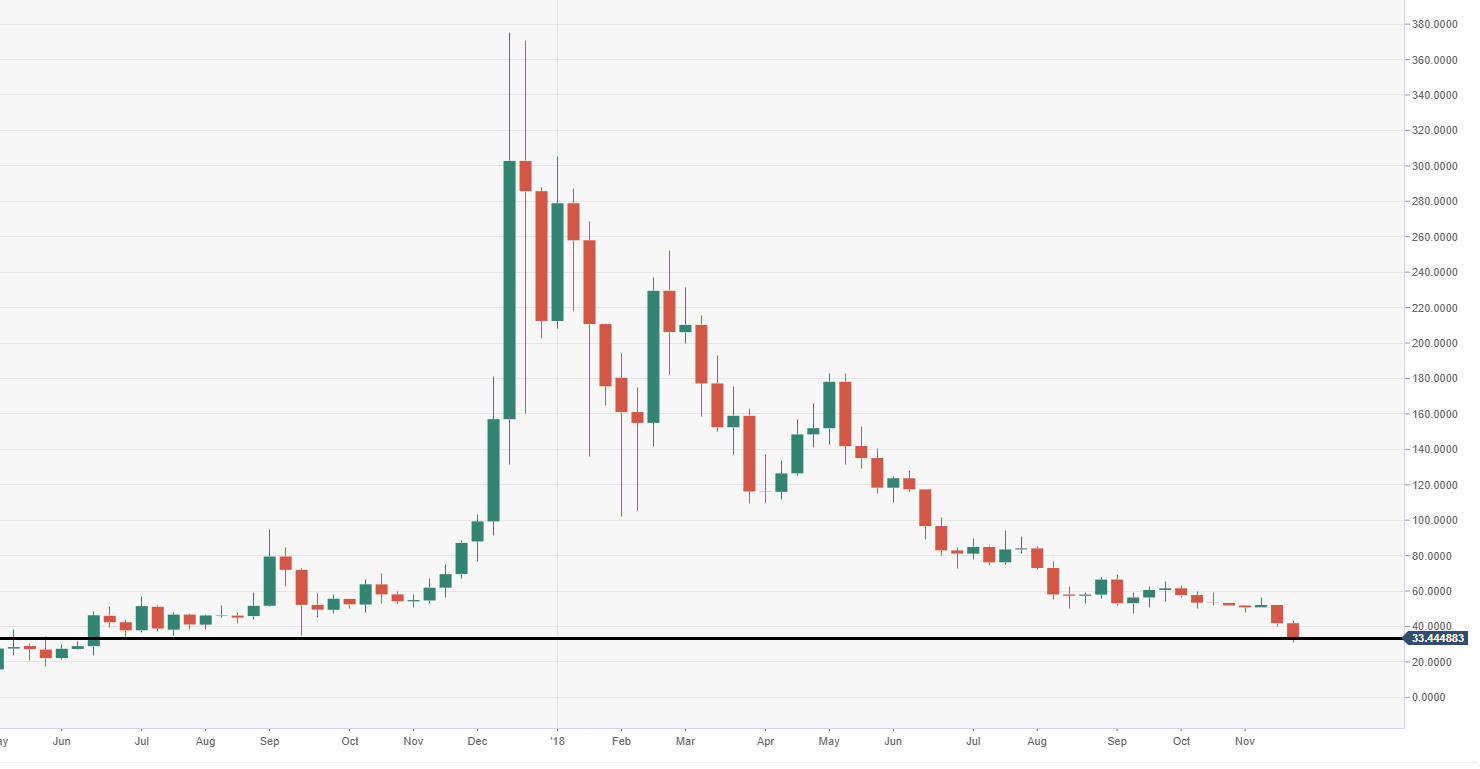
- Weekly support still holding, around the June 2017 low area.
LTC/USD 60-minute chart
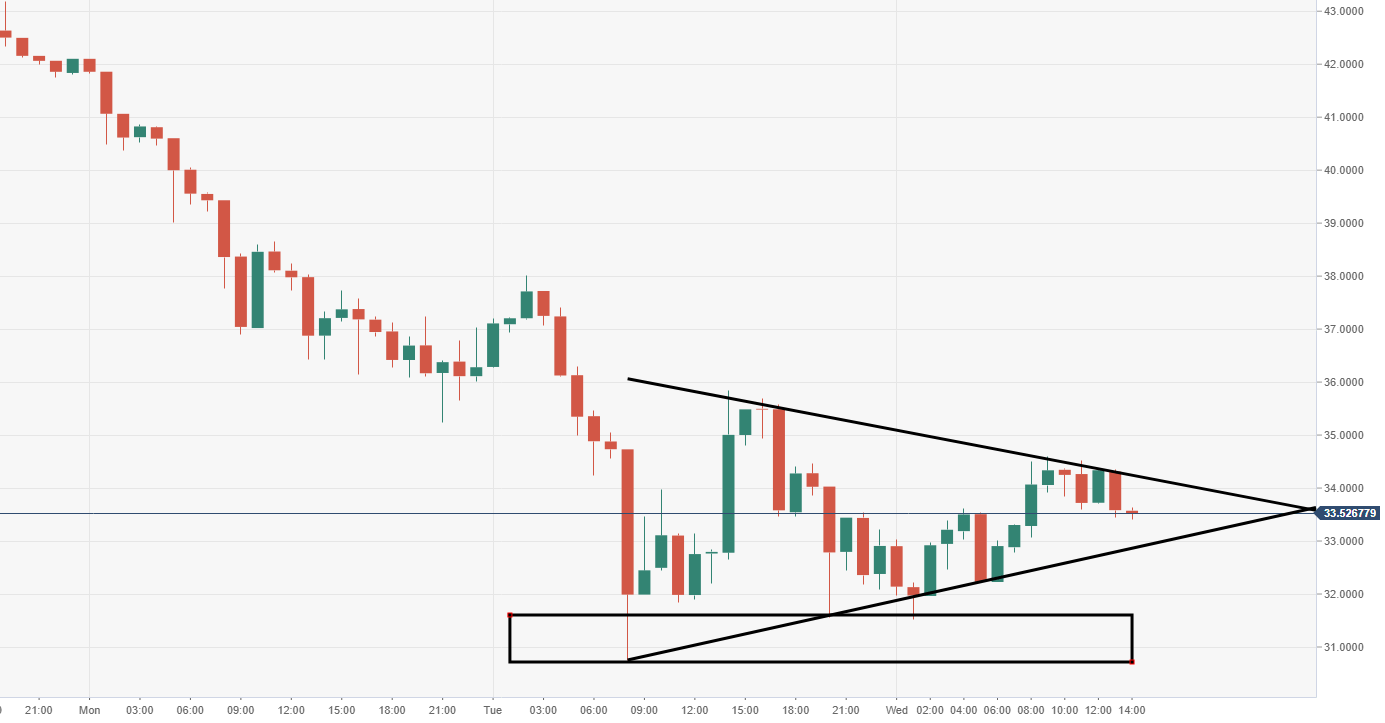
Spot rate: 33.53
Relative change: +0.70%
High: 38.00
Low: 31.52
Trend: Bullish/Neutral
Support 1: 32.88, lower trend line of pennant pattern.
Support 2: 31.50, demand area.
Support 3: 29.77, daily pivot point support.
Resistance 1: 34.20, upper trend line of pennant pattern.
Resistance 2: 37.02, daily pivot point resistance.
Resistance 3: 41.14, daily pivot point resistance.
LTC/USD weekly chart
- Weekly support still being tested around the June 2017 low area, a breach and close below could be punishing.