- Litecoin price is struggling on Monday, holding losses of over 2% in the session.
- LTC/USD bulls printed the highest level since September 2018, before running into the supply.
- Near-term top area observed between the region of $62-63, also observed on 16th March.
Spot rate: 59.51
Relative change: -2.50%
High: 63.09
Low: 58.49
Trends:
Daily SMA20: 53.4829
Daily SMA50: 45.4378
Daily SMA100: 37.9878
Daily SMA200: 44.5514
Levels:
Previous Daily High: 61.6663
Previous Daily Low: 60.1314
Previous Weekly High: 59.5591
Previous Weekly Low: 52.8137
Previous Monthly High: 53.9838
Previous Monthly Low: 30.8359
Daily Fibonacci 38.2%: 60.7177
Daily Fibonacci 61.8%: 61.0799
Daily Pivot Point S1: 60.1943
Daily Pivot Point S2: 59.3954
Daily Pivot Point S3: 58.6593
Daily Pivot Point R1: 61.7292
Daily Pivot Point R2: 62.4652
Daily Pivot Point R3: 63.2641
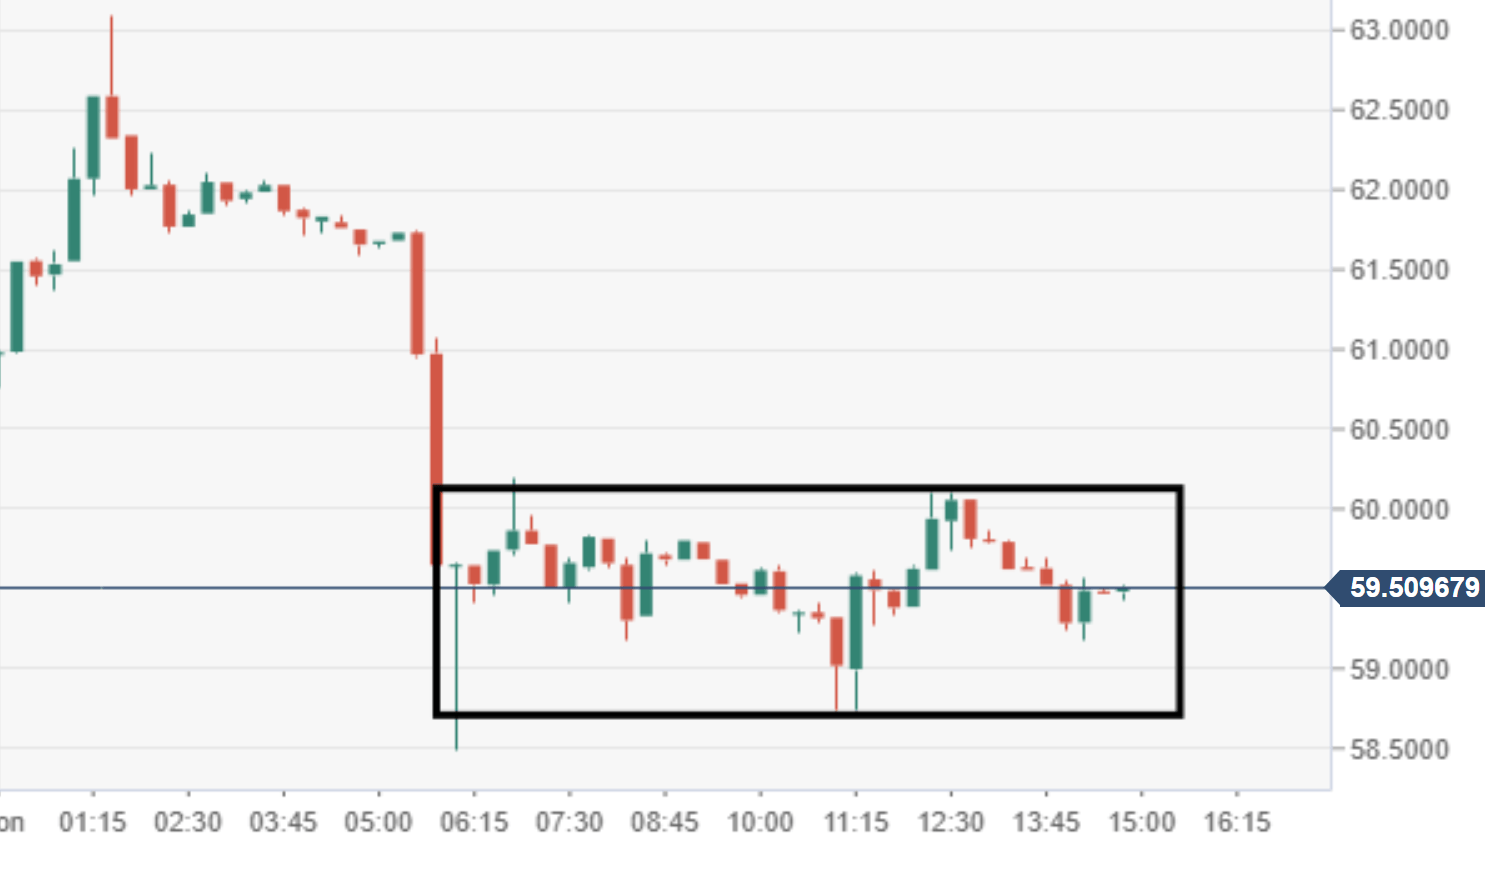
LTC/USD 15-minute chart
- There is a potential bearish flag formation here via the 15-minute chart view, subject to further selling pressure.
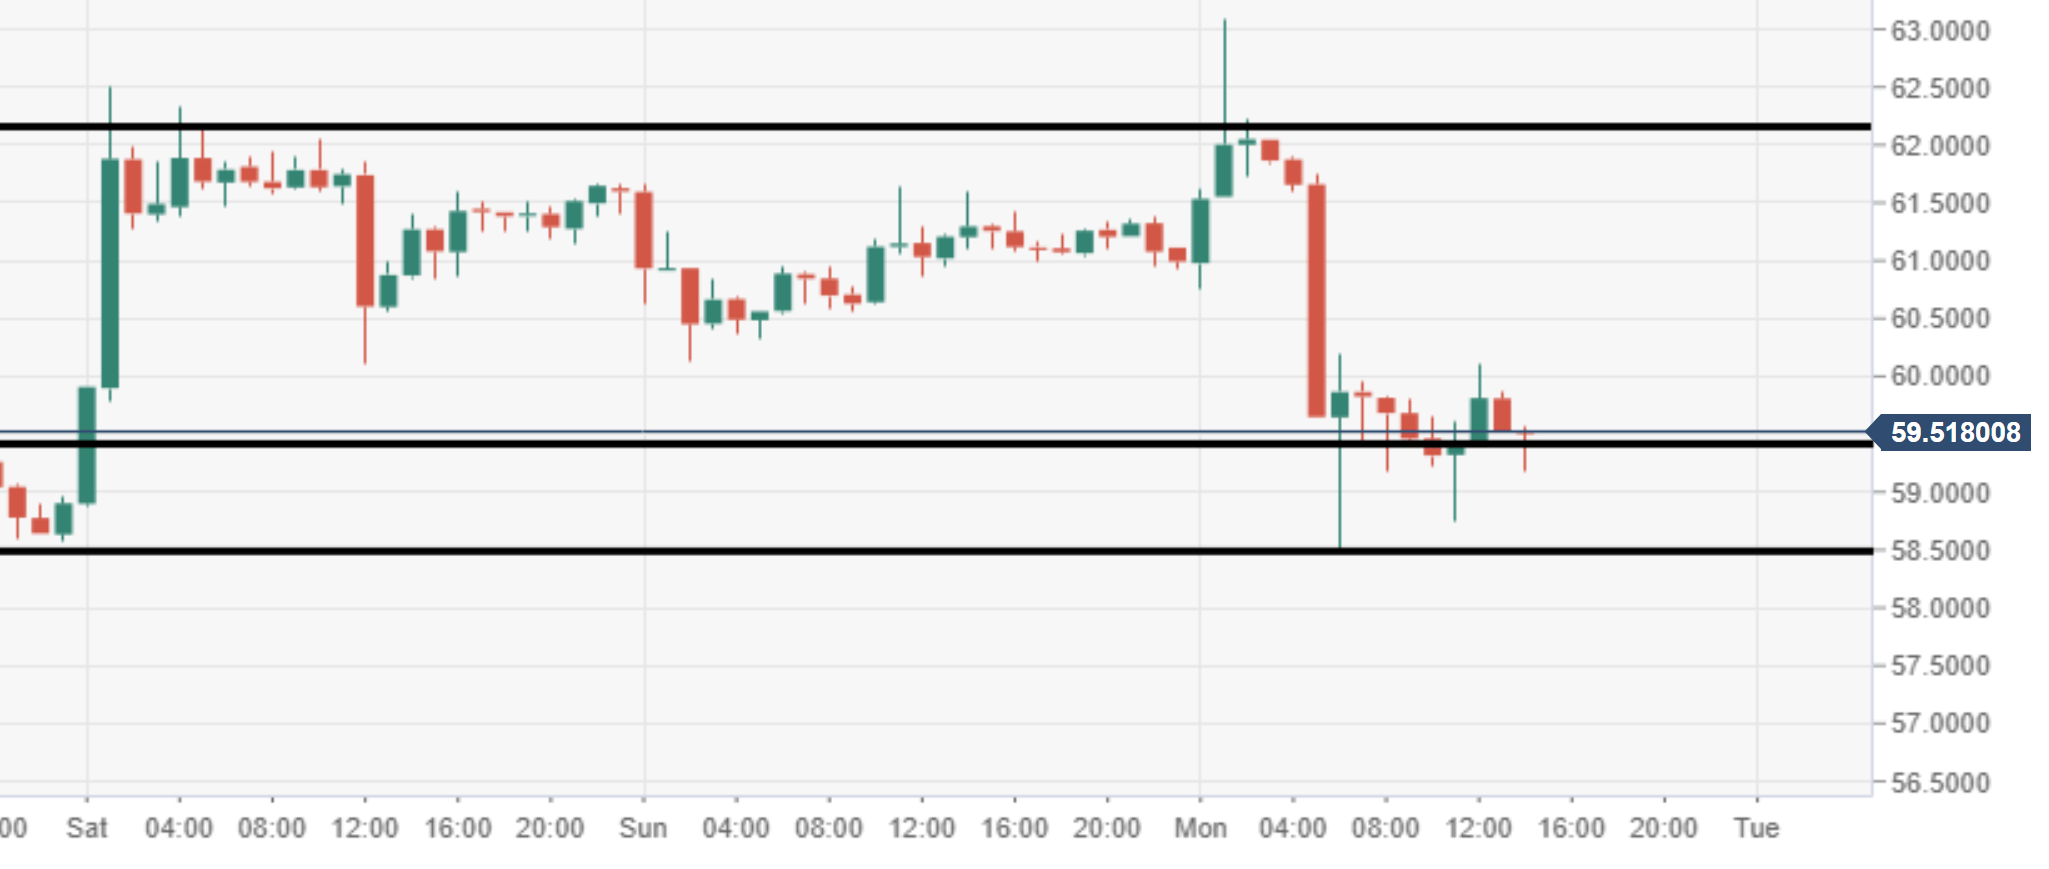
LTC/USD 60-minute chart
- The top area observed within the price region of $62-63, which was the high area of 16th March.
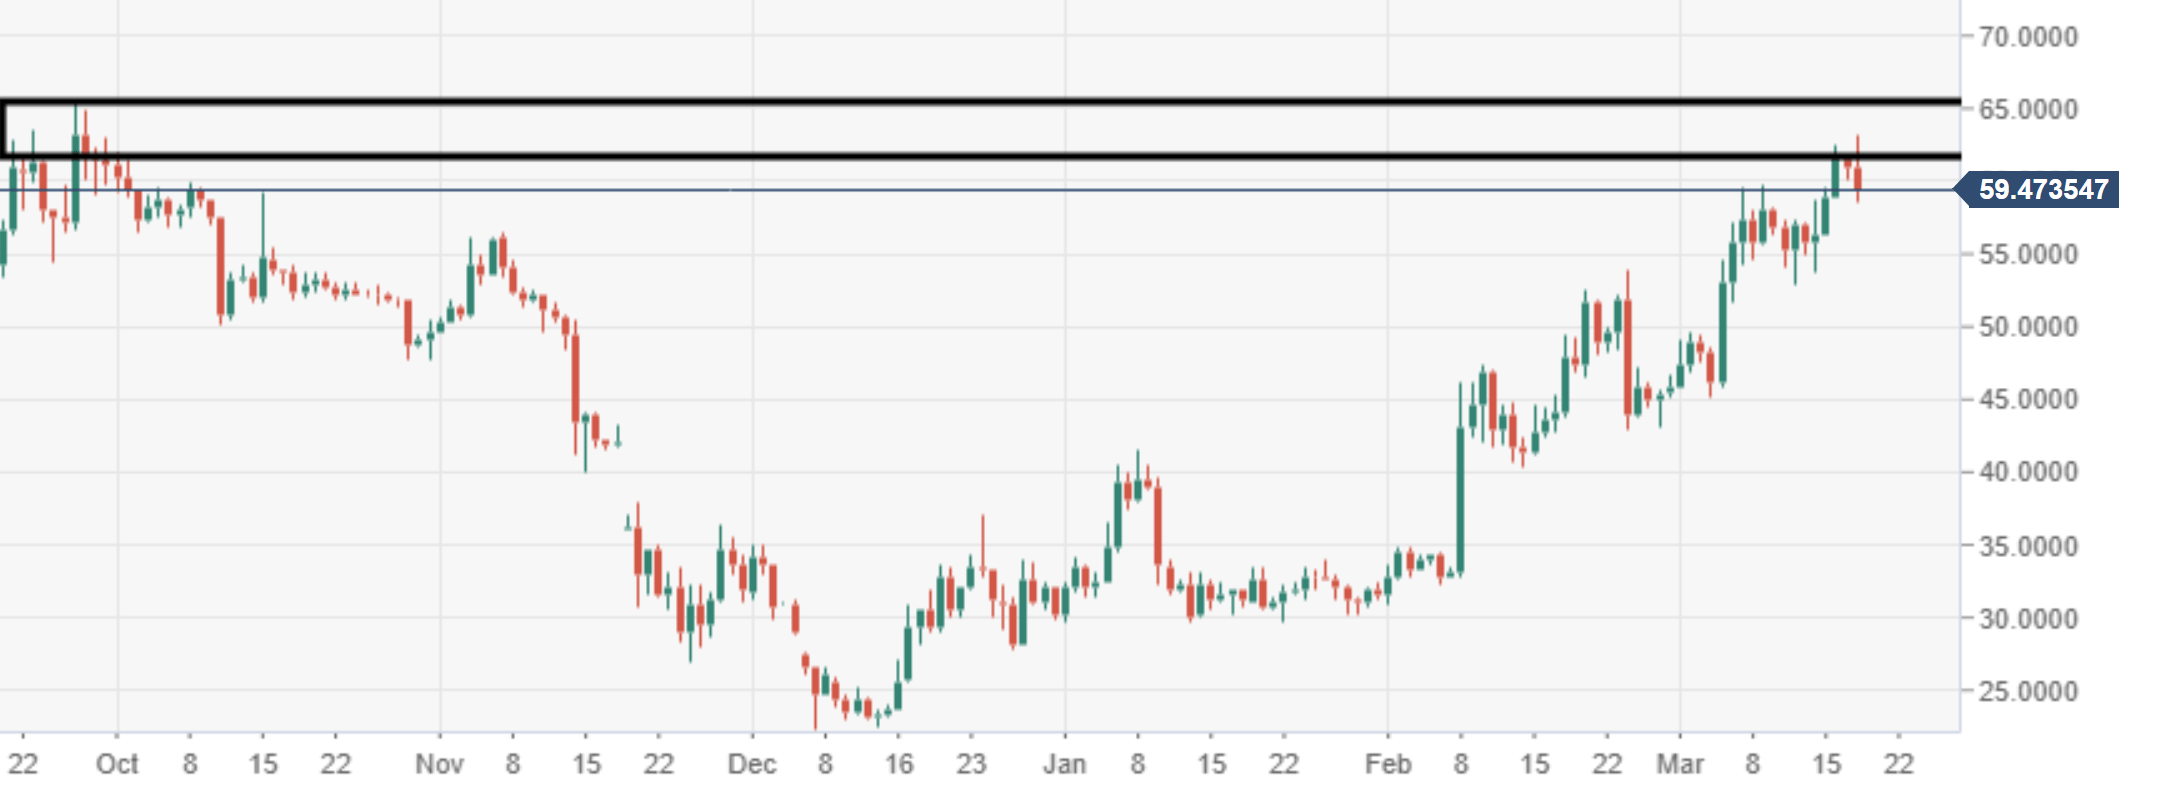
LTC/USD daily chart
- Bulls managed to run the price up to the highest levels since September 2018, but ran out of steam.