- Litecoin price late on Friday is nursing some losses of 0.5%, after a generally muted session.
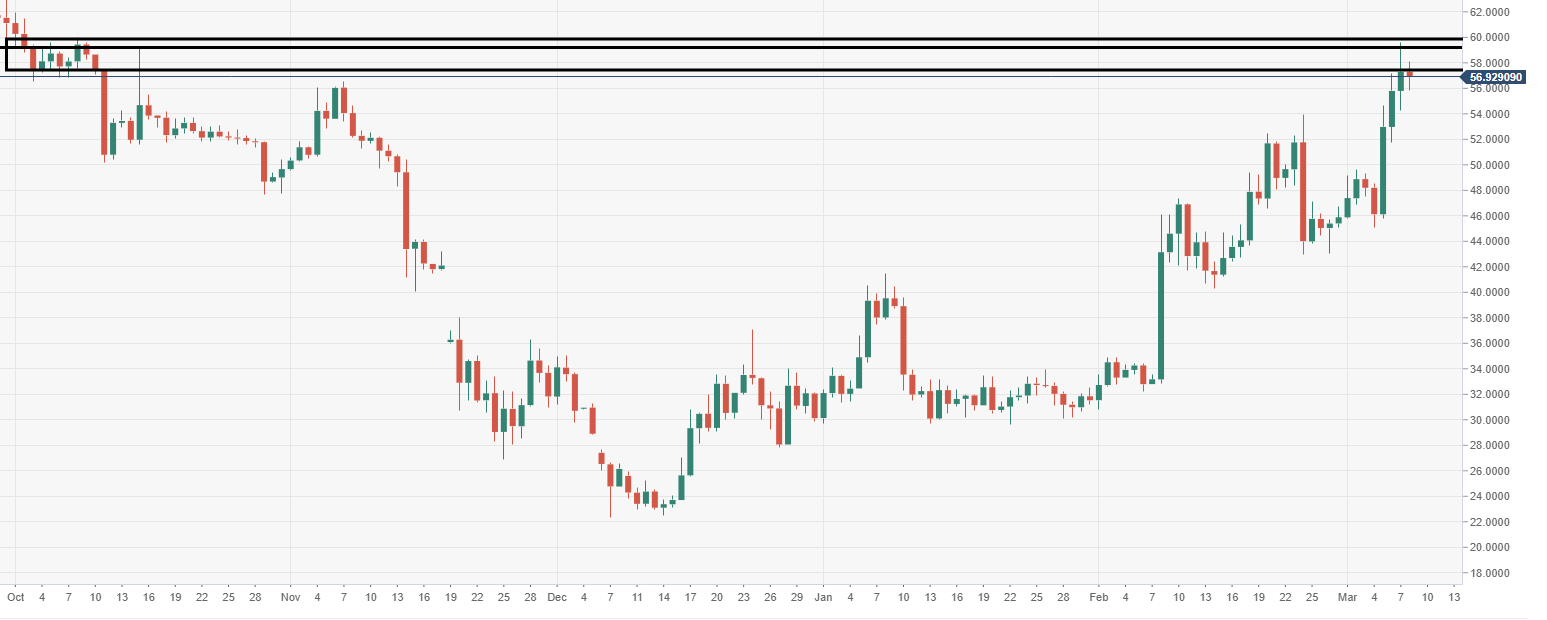
- LTC/USD produces a double top area up at October 2018 high levels.
Spot rate: 137.40
Relative change: -0.37%
High: 141.27
Low: 136.21
Trends:
Daily SMA20: 48.3858
Daily SMA50: 40.2695
Daily SMA100: 35.4117
Daily SMA200: 44.5238
Levels:
Previous Daily High: 59.5887
Previous Daily Low: 54.299
Previous Weekly High: 53.9838
Previous Weekly Low: 42.9646
Previous Monthly High: 53.9838
Previous Monthly Low: 30.8359
Daily Fibonacci 38.2%: 57.568
Daily Fibonacci 61.8%: 56.3197
Daily Pivot Point S1: 54.5312
Daily Pivot Point S2: 51.7702
Daily Pivot Point S3: 49.2414
Daily Pivot Point R1: 59.821
Daily Pivot Point R2: 62.3497
Daily Pivot Point R3: 65.1107
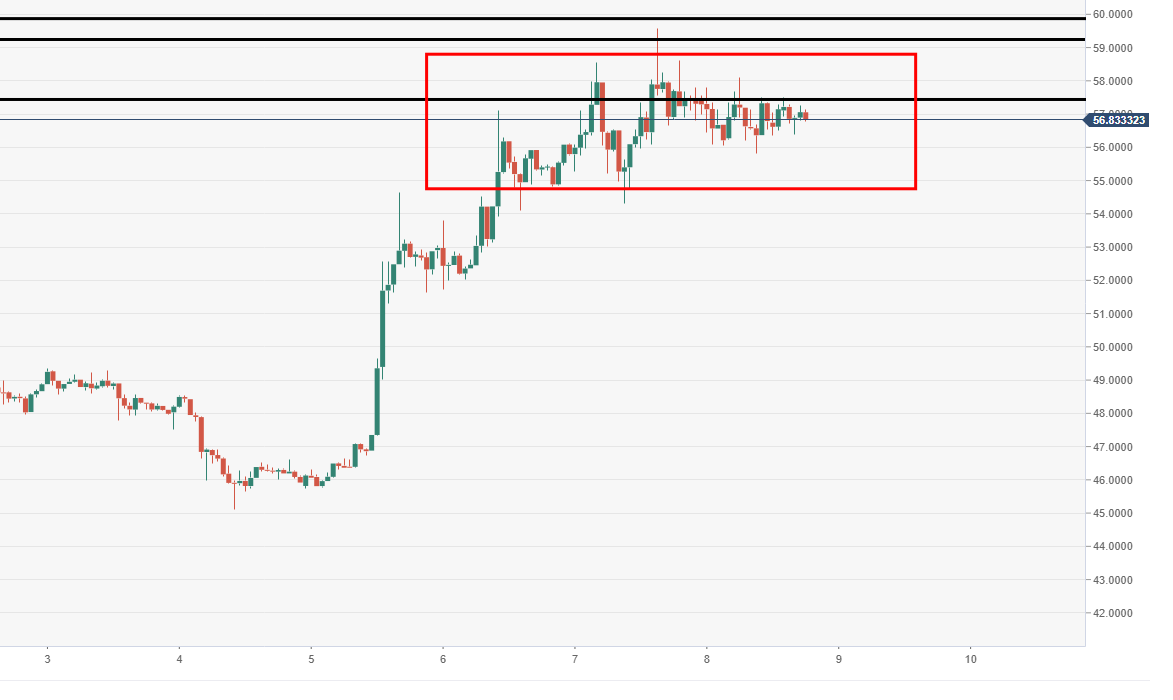
LTC/USD 60-minute chart
- Price action is ranging via the 60-minute losing upside momentum, subject to possible drop.
LTC/USD daily chart
- LTC/USD subject to ending the three day run of gains, as bulls run into chunky area of resistance via the daily.