Home Litecoin technical analysis: LTC/USD is stuck underneath bearish flag  structure
Crypto News

Litecoin technical analysis: LTC/USD is stuck underneath bearish flag  structure

  • Litecoin price is trading in the red in the session by some 1.10%.  
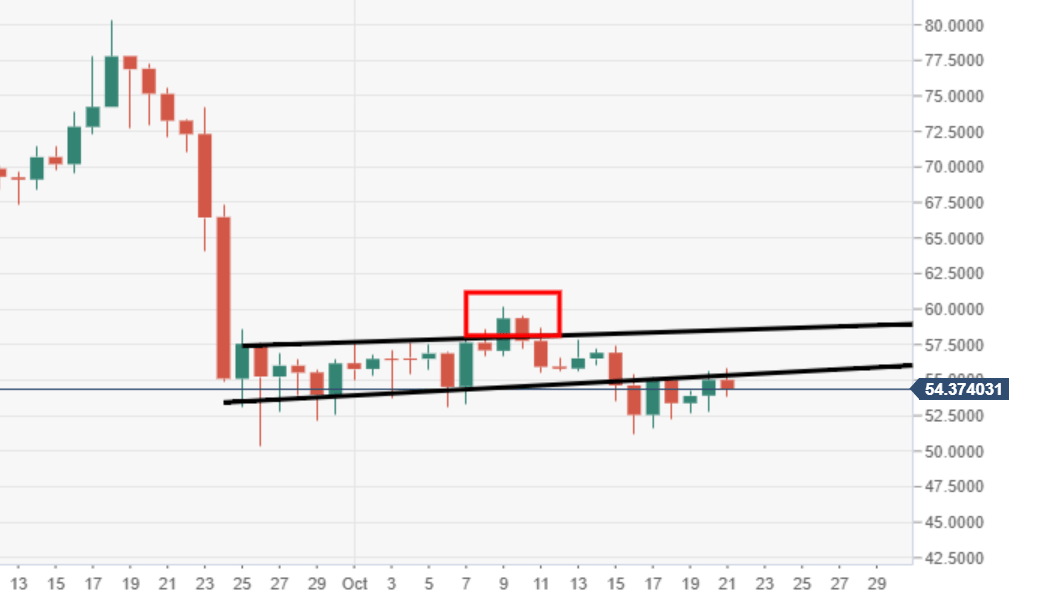
  • LTC/USD remains very much vulnerable to downside risks as it sits below the breached bear flag.  
  • Daily resistance should be noted at $55, where the lower acting trend line of flag is tracking.  


LTC/USD daily chart

The current daily price action is flirting underneath the breached flag structure.  

LTC/USD 60-minute chart

Price action is moving within an ascending wedge structure, subject to a potential breakout south.  
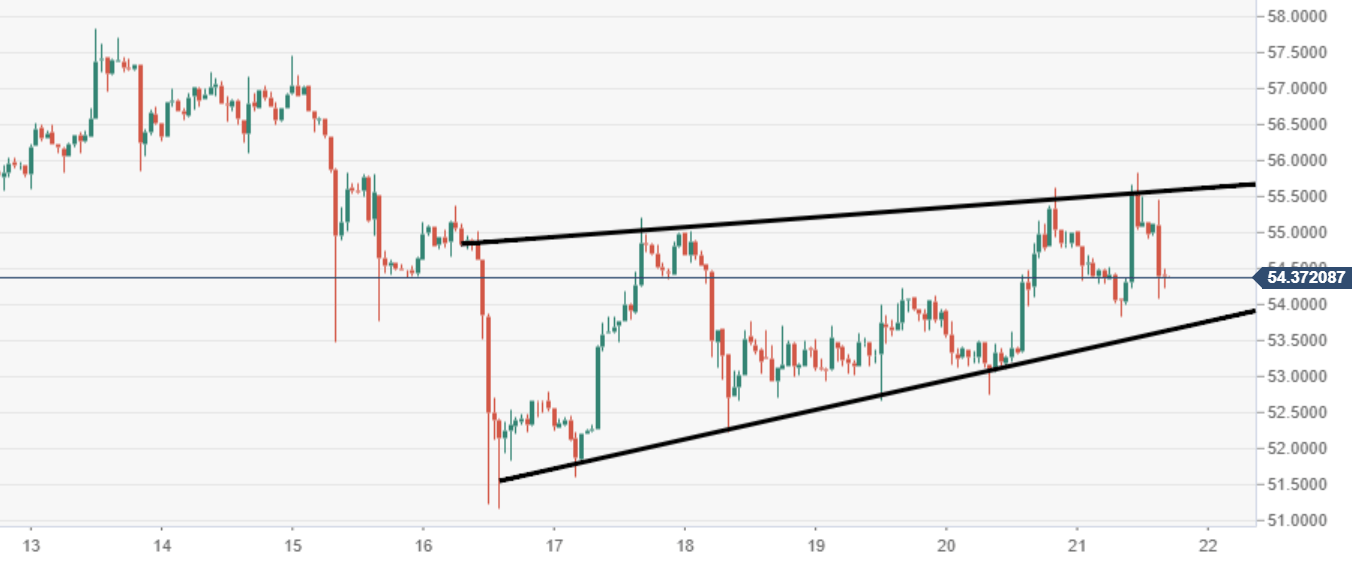
 

Spot rate:                   54.52

Relative change:       -1.10%

High:                          55.82

Low:                           53.83


FX Street

FX Street

FXStreet is the leading independent portal dedicated to the Foreign Exchange (Forex) market. It was launched in 2000 and the portal has always been proud of their unyielding commitment to provide objective and unbiased information, to enable their users to take better and more confident decisions.