- Litecoin price on Tuesday one of the outperformers, holding gains of some 3%.
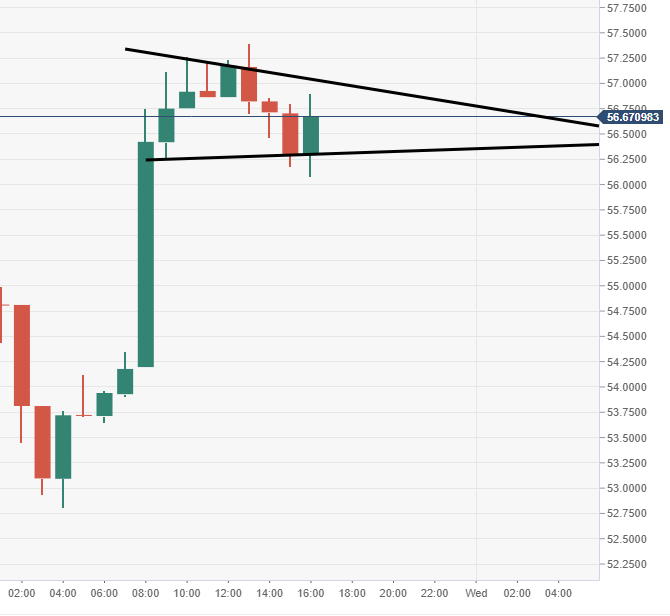
- LTC/USD price action via the 60-minute chart view has formed a bullish pennant pattern.
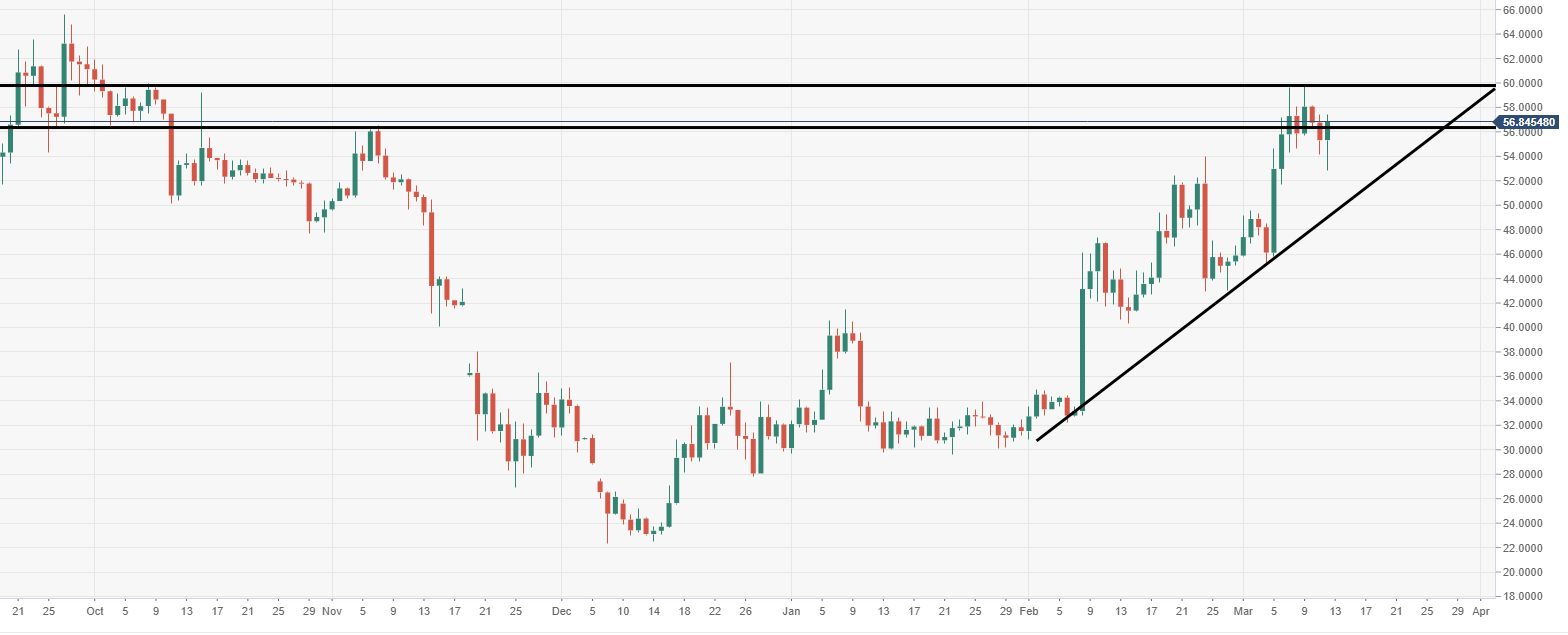
- An ascending channel formation can be observed via the daily chart view.
Spot rate: 56.72
Relative change: +3.03%
High: 56.89
Low: 56.08
Trends:
Daily SMA20: 50.5426
Daily SMA50: 42.2454
Daily SMA100: 36.3821
Daily SMA200: 44.5289
Levels:
Previous Daily High: 57.4
Previous Daily Low: 54.1298
Previous Weekly High: 59.5887
Previous Weekly Low: 45.1089
Previous Monthly High: 53.9838
Previous Monthly Low: 30.8359
Daily Fibonacci 38.2%: 55.379
Daily Fibonacci 61.8%: 56.1508
Daily Pivot Point S1: 53.8346
Daily Pivot Point S2: 52.3471
Daily Pivot Point S3: 50.5643
Daily Pivot Point R1: 57.1048
Daily Pivot Point R2: 58.8875
Daily Pivot Point R3: 60.375
LTC/USD 60-minute chart
- Price action moving within a pennant pattern structure, subject to a potential extended move north.
LTC/USD daily chart
- Bulls are attempting to breakdown chunky near-term supply heading into the $60 price territory.