Home Litecoin Technical  Analysis: LTC/USD on the slippery slope south, as the bears continue to sell rallies
Crypto News

Litecoin Technical  Analysis: LTC/USD on the slippery slope south, as the bears continue to sell rallies

  • Litecoin was seen trading broadly flat on Monday, as the bears sold the gains seen over the weekend.
  • LTC/USD is moving within a descending wedge pattern, not enough momentum for a break higher as of yet.


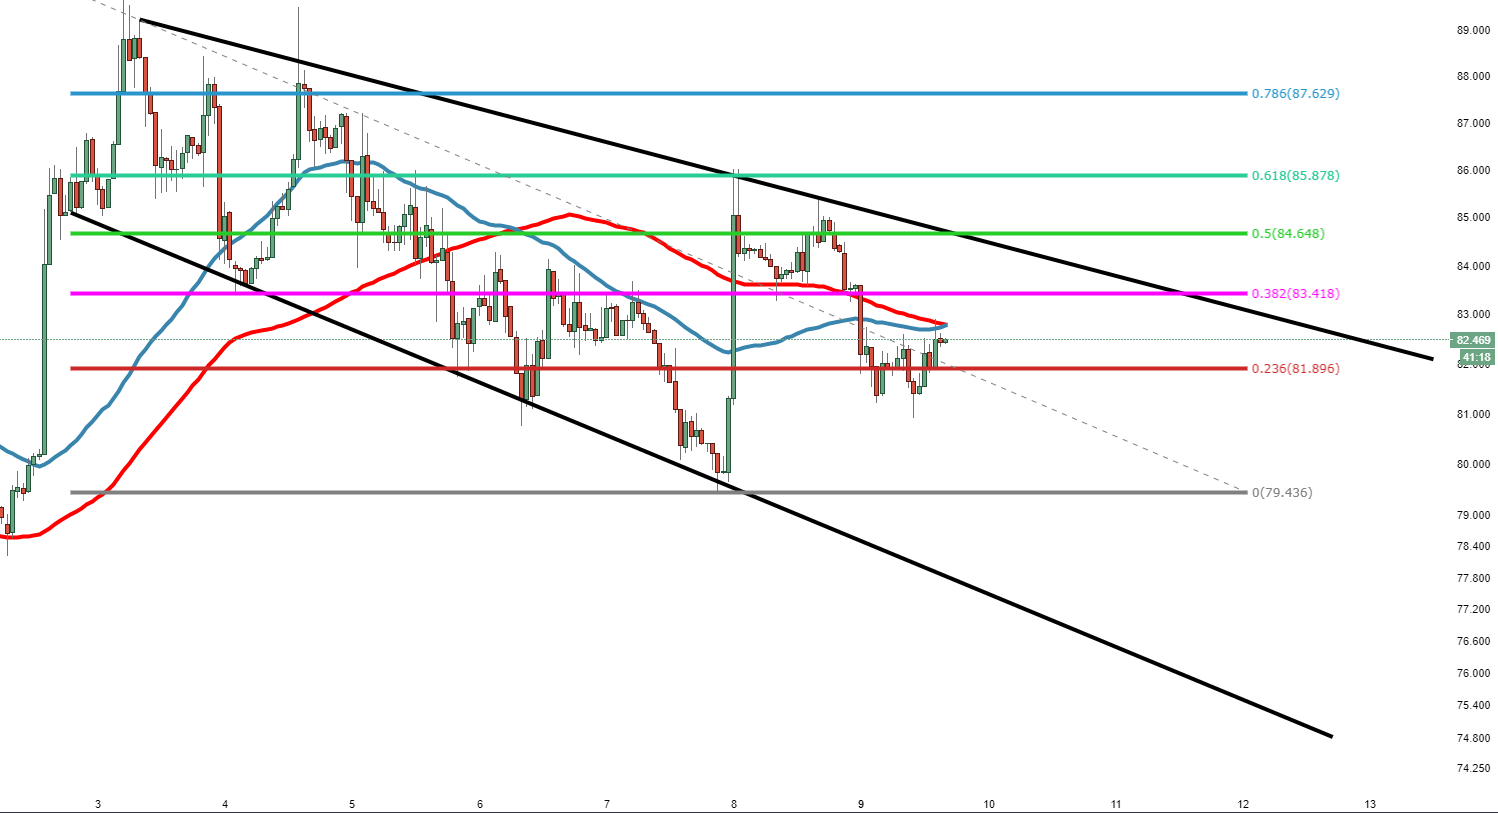
LTC/USD 60-minute chart


Spot rate:                                    0.47752

Relative change:               -0.25%

High:                                                   0.48090

Low:                                                      0.47320


Trend:                                                 Neutral


Support 1:                                  81.935, 23.6% Fibonacci & (support on 60-minute chart).

Support 2:                                    80.896, today’s (Monday) low.    

Support 3:                                  78.177, lower part of descending wedge.  

Resistance  1:                        82.765, 50 & 100MA.

Resistance 2:                         83.418, 38.2% Fibonacci.

Resistance 3:                          84.450, upper part of descending wedge.    


FX Street

FX Street

FXStreet is the leading independent portal dedicated to the Foreign Exchange (Forex) market. It was launched in 2000 and the portal has always been proud of their unyielding commitment to provide objective and unbiased information, to enable their users to take better and more confident decisions.