Home Litecoin Technical Analysis: LTC/USD price behaviour suggesting of another breakout to the downside, with $100 mark once again in the eyes of the bears
Crypto News

Litecoin Technical Analysis: LTC/USD price behaviour suggesting of another breakout to the downside, with $100 mark once again in the eyes of the bears

  • The Litecoin price was further hit on Tuesday, dropping 2%, after running into resistance around $108.
  • Supply zone preventing a break higher, tracking from $107.60-108.40.
  • Bearish pennant pattern can be seen forming on the 30-minute chart.


LTC/USD 60-minute chart
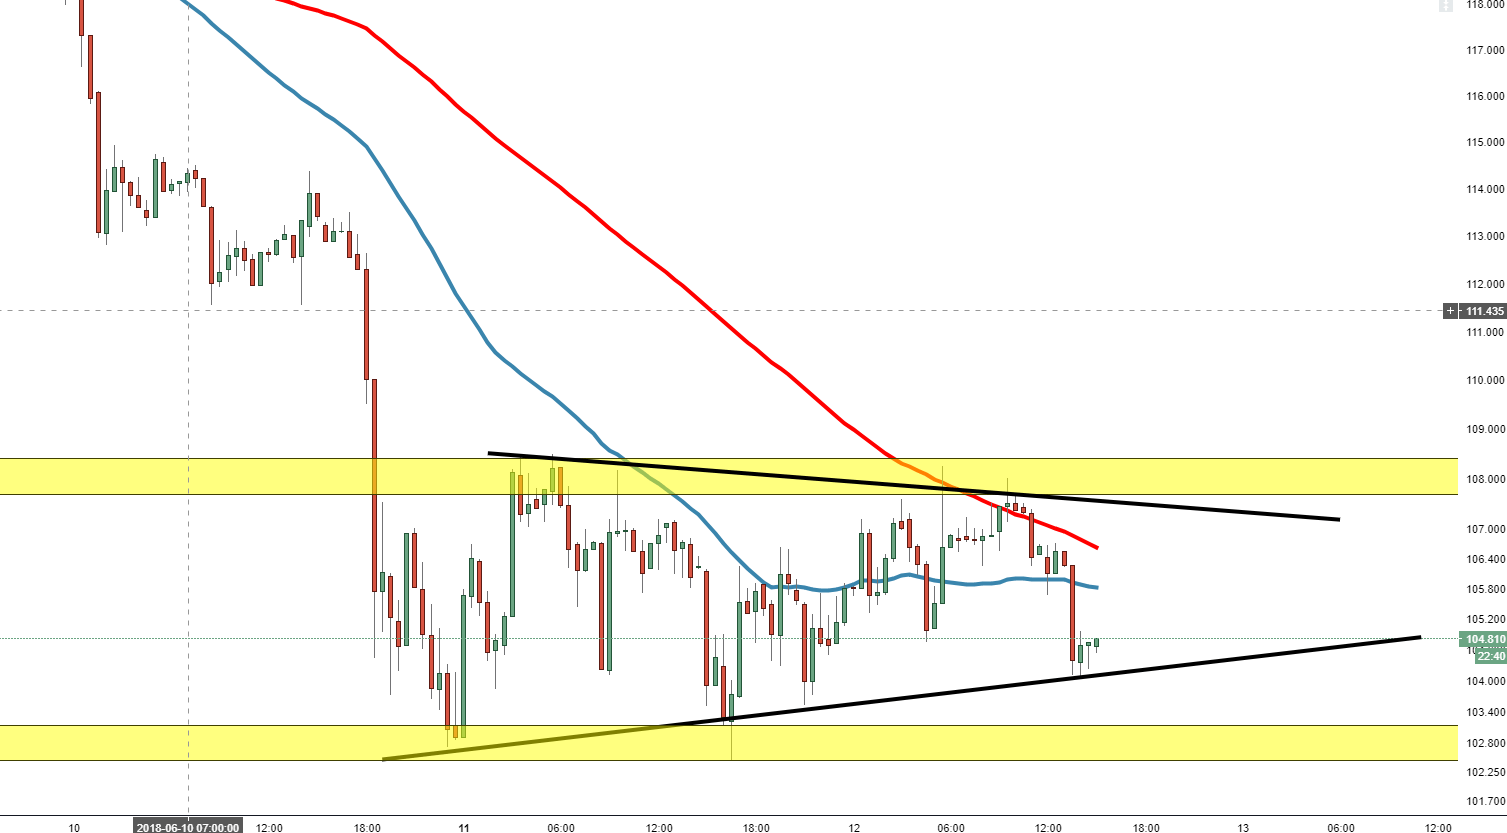
Spot rate:                                     104.70

Relative change:               – 2.05%

High:                                                     108.24

Low:                                                       104.08


Trend:                                                   Bearish


Support 1:                                  104.03, lower trend line of pennant.

Support 2:                                    103.00, entry of demand zone.

Support 3:                                    102.40, 29th May low.  

Resistance 1:                           105.75, 50MA.

Resistance 2:                           106.60, supply zone entry.

Resistance 3:                           107.50, upper trend line of pennant.  


FX Street

FX Street

FXStreet is the leading independent portal dedicated to the Foreign Exchange (Forex) market. It was launched in 2000 and the portal has always been proud of their unyielding commitment to provide objective and unbiased information, to enable their users to take better and more confident decisions.