Home Litecoin Technical Analysis: LTC/USD re-approaching the catastrophic 9 month lows, as the bears look at taking out the $70 level, which could be devastating for the price
Crypto News

Litecoin Technical Analysis: LTC/USD re-approaching the catastrophic 9 month lows, as the bears look at taking out the $70 level, which could be devastating for the price

  • Litecoin nursing losses of over 1.5%, as it continues to be hit with selling pressure.
  • LTC/USD ran into strong resistance between $77-75, being forced to know defend $70 territory.  
  • Eyes are on a retest of the lows on 4th and 5th August, which marked the lowest level since November 2017 at $72.155.  


LTC/USD 4-hour chart
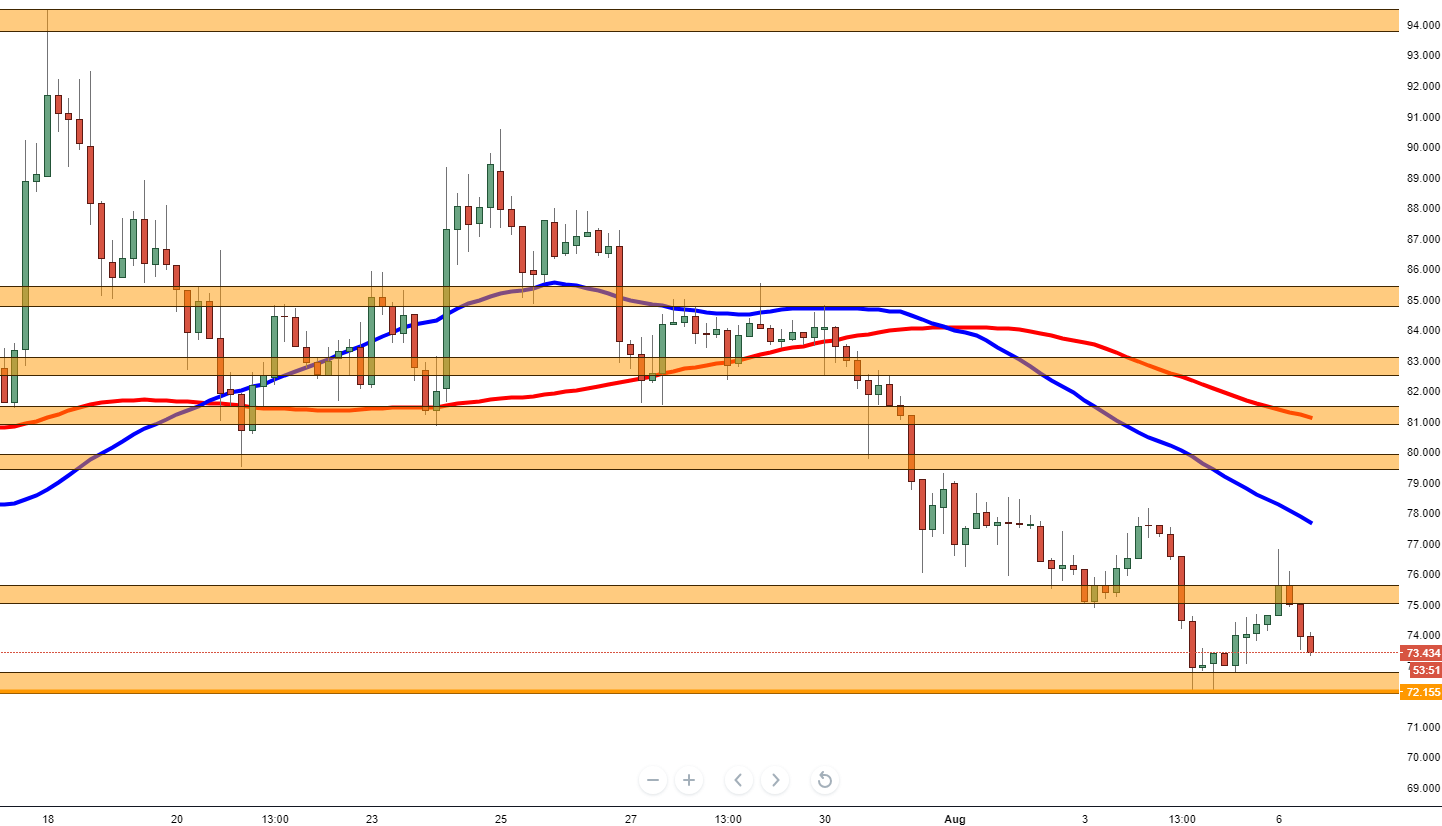


Spot rate:                    73.434

Relative change:        -1.60%

High:                          76.789

Low:                           73.280

Trend:                        Bearish


Support 1:                  73.061, (support on 4-hour chart).  

Support 2:                  72.750, demand zone entrance.  

Support 3:                  72.155, 4th and 5th August low, (9-month low).

Resistance 1:             75.000, supply zone.

Resistance 2:             77.550, 50MA.

Resistance 3:             76.550, 100MA, supply zone & 21st July low.  


FX Street

FX Street

FXStreet is the leading independent portal dedicated to the Foreign Exchange (Forex) market. It was launched in 2000 and the portal has always been proud of their unyielding commitment to provide objective and unbiased information, to enable their users to take better and more confident decisions.