Home Litecoin Technical  Analysis: LTC/USD shakes of the scare and sees promising breakout from a descending wedge
Crypto News

Litecoin Technical  Analysis: LTC/USD shakes of the scare and sees promising breakout from a descending wedge

  • Litecoin price sees chunky jump to the upside of 5% on Thursday, after renewed buying comes back to the market.  
  • LTC/USD made a decent breakout to the upside from a descending channel pattern.  


LTC/USD 4-hour chart  
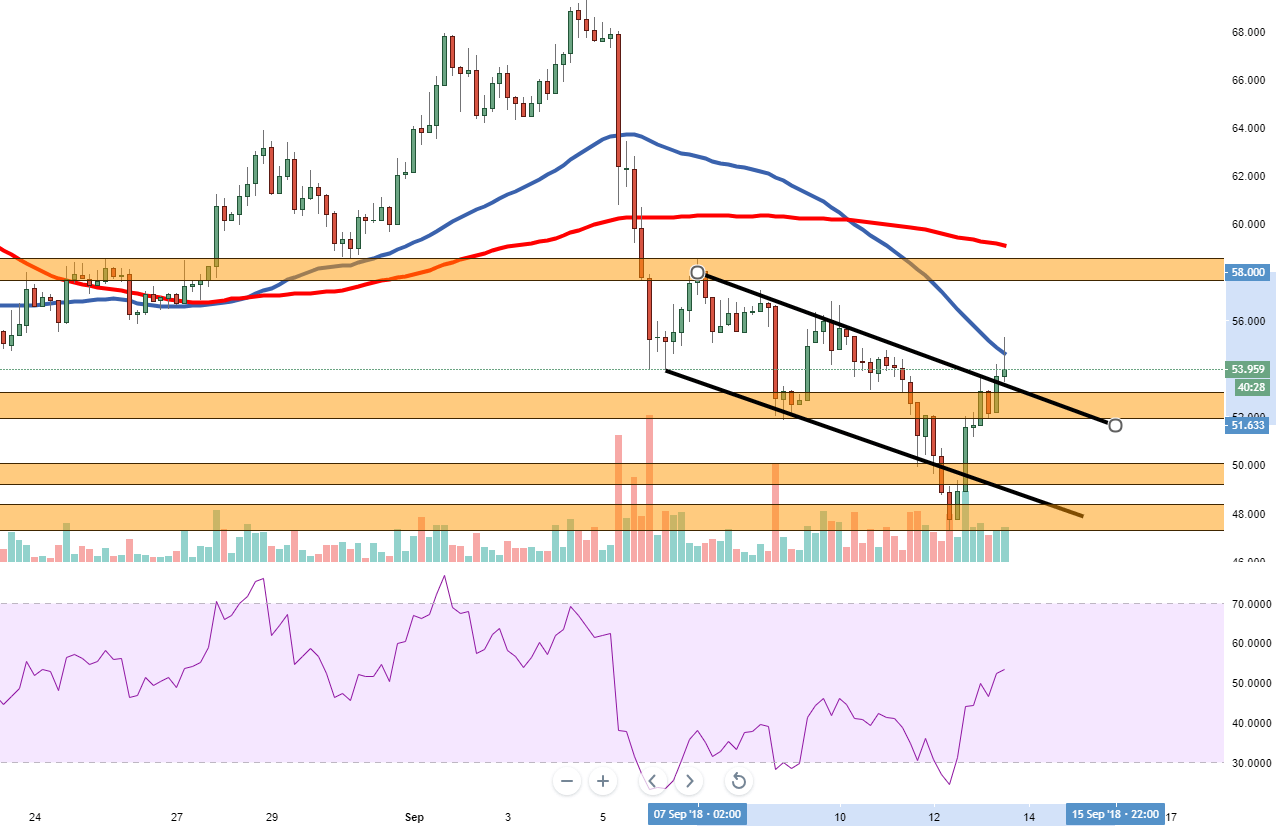


Spot rate:                    54.243

Relative change:        +5.06%

High:                           55.278

Low:                            51.644


Trend:                         Bullish


Resistance 1:              54.580, 50MA.

Resistance 2:             56.820,  resistance on 4-hour chart.

Resistance 3:             57.700, entrance to supply zone.  

Support 1:                   53.255, on top of broken channel.

Support    2:                  52.000,  demand area.  

Support    3:                  49.150, lower trend line of channel & demand area.


FX Street

FX Street

FXStreet is the leading independent portal dedicated to the Foreign Exchange (Forex) market. It was launched in 2000 and the portal has always been proud of their unyielding commitment to provide objective and unbiased information, to enable their users to take better and more confident decisions.