- LTC/USD went up from $79.75 to $102 over the last two days.
- Elliot oscillator had two straight bullish sessions after two weeks of bearish sessions.
LTC/USD daily chart
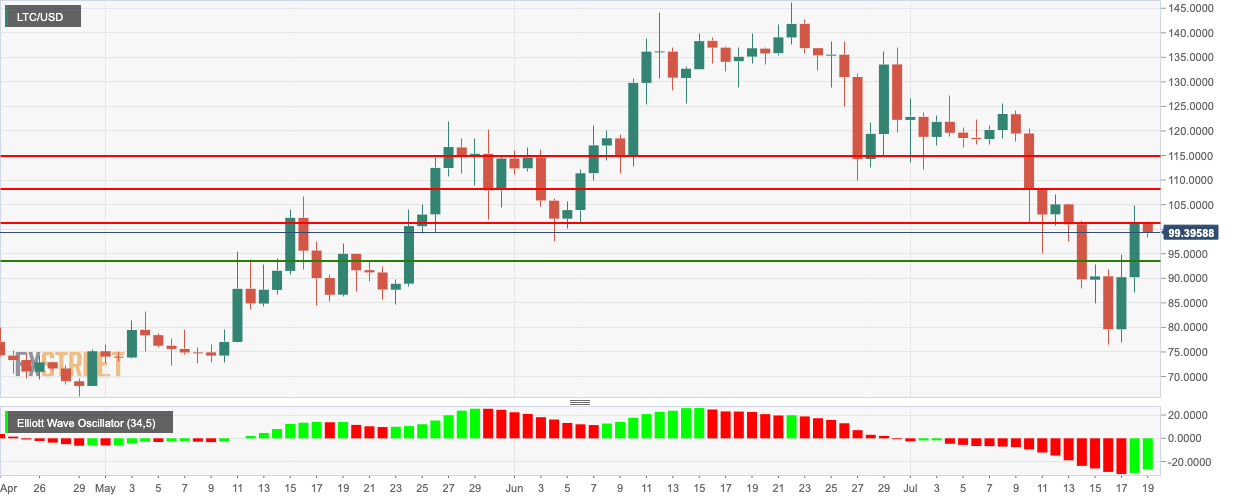
LTC/USD has dropped from $102 to 99.60 in the early hours of Friday after meeting market resistance. Before this, LTC/USD had two heavily bearish days where the price spiked from $79.75 to $102. The Elliot oscillator had two straight bullish sessions after two weeks of bearish sessions.
LTC/USD 4-hour chart
-636991085900381345.png)
The 4-hour price chart shows a bearish breakout from the upward trending line. The price is floating below the green Ichimoku cloud. The relative strength index (RSI) indicator was going into the overbought zone when it bounced down and is currently trending around 63.63.
LTC/USD hourly chart
-636991085247096112.png)
The hourly chart has been trending horizontally and has touched the 20-day simple moving average (SMA 20) curve. The price is still in the upper half of the 20-day Bollinger band. The moving average convergence/divergence show two bearish sessions following ten straight bullish sessions, indicating that the bears are fighting back in the short term.
Key Levels
