- LTC/USD has found resistance on the downward trending line.
- The hourly LTC/USD price is currently trending horizontally.
LTC/USD daily chart
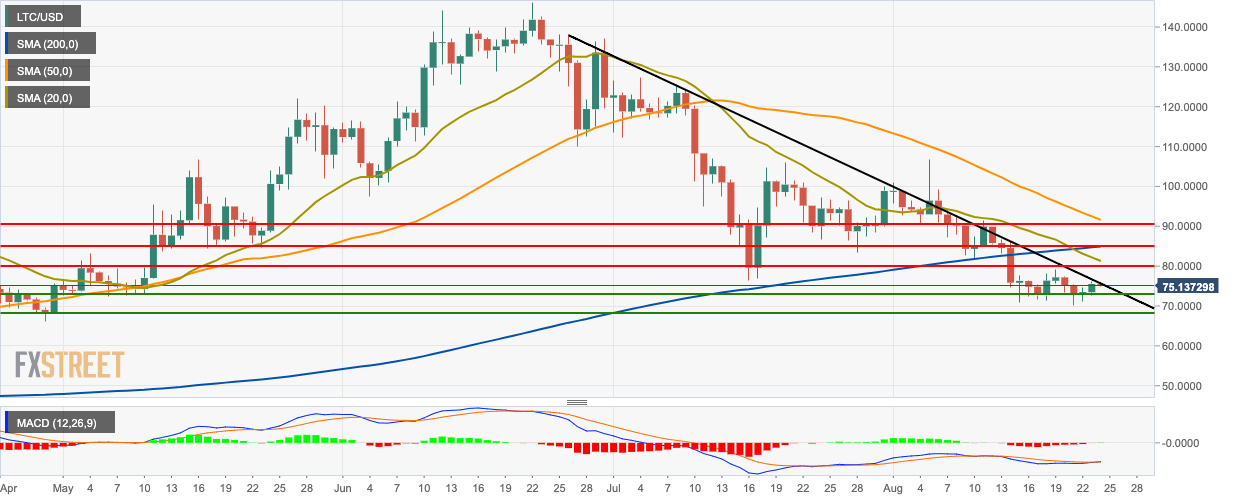
Following a bullish Friday, LTC/USD managed to have a bearish start to Saturday. This Friday, the price of LTC/USD went up from $73.50 to $75.65. Litecoin has gone down to 75.15 so far this Saturday and is facing resistance from the downward trending line. The price is trending below the 200-day simple moving average (SMA 200), SMA 50 and SMA 20 curves. The moving average convergence/divergence (MACD) indicator shows a reversal of market momentum from bearish to bullish.
LTC/USD 4-hour chart
-637022080539406525.png)
The 4-hour LTC/USD price is consolidating in a flag formation. The price is trending above the SMA 50 and SMA 20 curves and is below the SMA 200 curve. The 20-day Bollinger jaw is widening a little bit, which hints at increasing market volatility. The Elliott oscillator has had four straight bullish sessions.
LTC/USD hourly chart
-637022080135020884.png)
The hourly LTC/USD is trending horizontally around the $75.25 resistance line. The price has spiked above the green Ichimoku cloud. The relative strength index (RSI) indicator was trending right next to the overbought zone and then dipped down to 61.
Key Levels
