By Todd Gordon, Founder www.TradingAnalysis.com
Short Set-up for AUD/USD
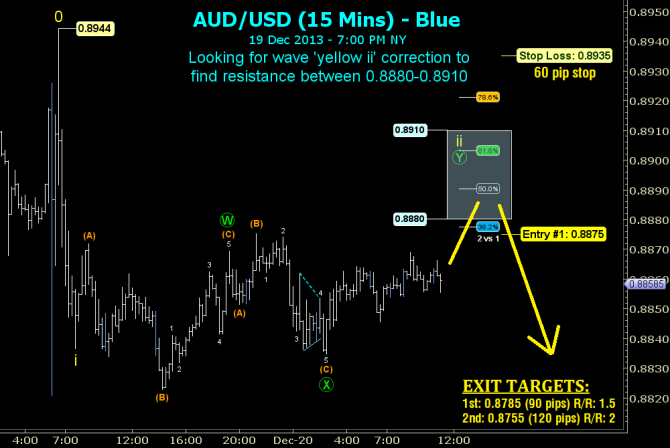
“¢ Trade: Sell AUD/USD at 0.8875 (or anywhere between 0.8875 to 0.8910)
“¢ Stop Loss: Place stop at 0.8935.
“¢ Take Profit: Two profit positions: first half at 0.8785 and second half at 0.8755.
“¢ Trade Management: On reaching 0.8785, move stop to 0.8875 (irrespective of entry level).
The recent FOMC decision caused many pairs to move wildly, including the AUD/USD. Note the tall bars on the left side of the chart which show the price action during that time. Since the FOMC high at 0.8944, the bars on the chart are smaller (and back to normal size), so we’re interested in looking for a trade now that the news is over.
AUD/USD has been in a clear downtrend since October 23, so we prefer short entries. Below 0.8944, we can see a sharp impulsive move to the downside which ends at wave ‘yellow i’. Since then, price has been in an unusually long correction, which we’ve labelled as a complex green WXY. Based on the first two green legs W and X, we’re looking for a move up in green Y between 0.8880 and 0.8910 (which will end the correction of wave ‘yellow ii’).
Therefore, our suggested entry is just below this expected resistance zone at 0.8875. There are a couple of ways to place the stop. The more conservative is to set the stop “where the Elliott Wave count is wrong”, which in this case is behind 0.8944. We’d prefer to set the stop behind the 78.6% retracement (i.e. behind 0.8921) at 0.8935 (which allows for a slight spike through this level and the AUD/USD spread). Our preferred stop is therefore 60 pips. Typically, the 78.6% retracement level tends to be the “level of last resort”.
We’re looking to exit the first half of our position at 0.8785 and the second half at 0.8755. From a risk versus reward perspective, the first half trade is risking 60 pips to make 90 pips (i.e. risk $6 to make $9) while the second target is 120 pips away (risking $6 to make $12). Both are acceptable from a risk/reward perspective.
However, proposing a trade solely based on looking at one chart and calculating one Elliott Wave count is risky. The risk is mitigated by assessing current correlations. From around mid October, AUD/USD has been strongly correlated with gold. A check of the gold chart also shows a clear downtrend during this period, and with gold making new lows after the FOMC decision, further weakness in AUD/USD seems possible.
