- Loopring price had a major rally towards $0.621 but also suffered a significant 34% correction.
- The digital asset has bounced back up from a low of $0.4 as several indicators show it’s poised for a recovery.
Loopring saw a 260% rally in the past three days from a low of $0.17 to a two-year high at $0.621. The digital asset had its biggest trading volume spike at $1 billion in 24 hours and it’s still in an uptrend.
Loopring needs to defend crucial support level to resume uptrend
LRC has found strong support at $0.4 and has experienced a 21% bounce from this level. The digital asset remains bullish and the TD Sequential indicator has just presented a buy signal in the form of a red ‘9’ candlestick on the 2-hour chart.
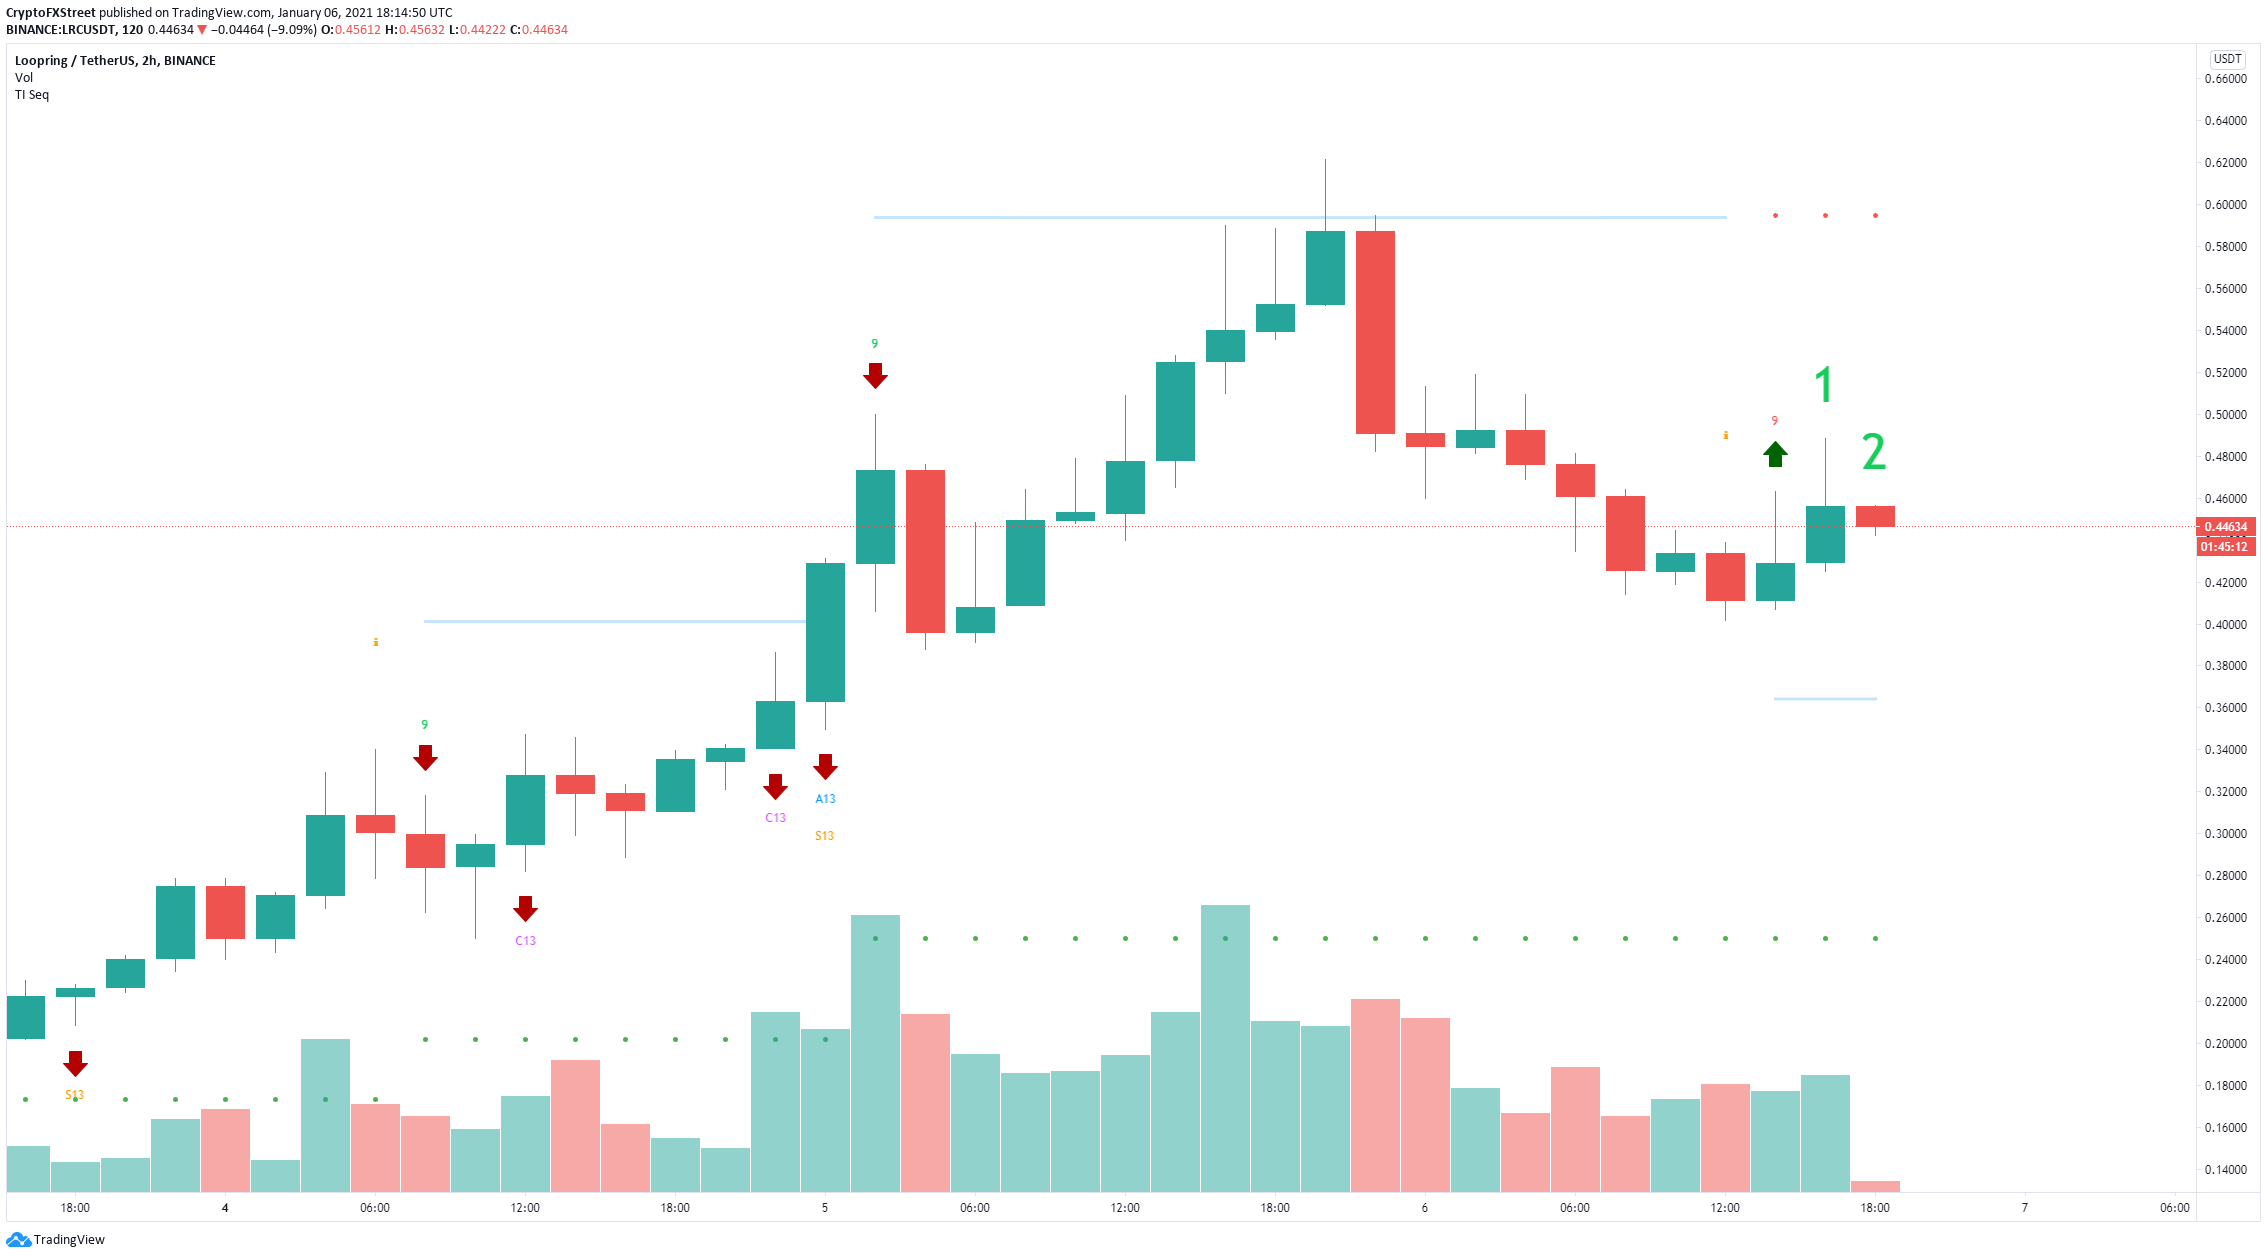
LRC/USD 2-hour chart
The In/Out of the Money Around Price (IOMAP) chart indicates that the strongest support area is located between $0.396 and $0.41, which adds credence to the bullish outlook above. It also shows very little resistance to the upside when compared to the $0.4 support point.
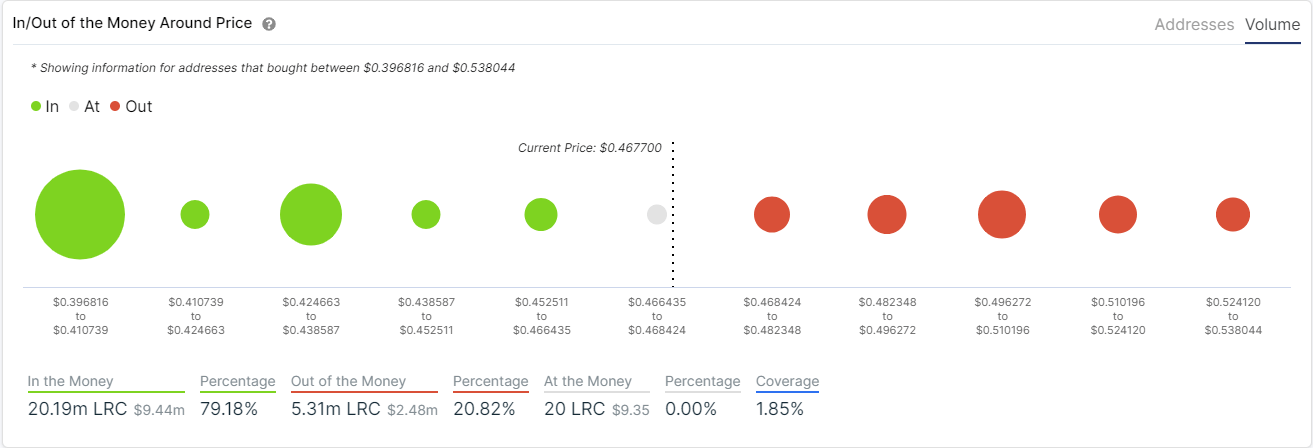
LRC IOMAP chart
However, the $0.4 support level is the only strong one nearby. If bulls fail to hold this point and LRC drops below it, it could easily dip towards the psychological level at $0.3 in the longer-term, which would be a clear shift in favor of the bears.
